
Compare Mufin Green with Similar Stocks
Dashboard
Strong Long Term Fundamental Strength with a 47.13% CAGR growth in Operating Profits
Healthy long term growth as Net Sales has grown by an annual rate of 56.89% and Operating profit at 47.13%
With a growth in Net Profit of 58.2%, the company declared Very Positive results in Mar 26
Increasing Participation by Institutional Investors
Market Beating Performance
Stock DNA
Non Banking Financial Company (NBFC)
INR 2,700 Cr (Micro Cap)
97.00
21
0.00%
2.43
4.76%
4.62
Total Returns (Price + Dividend) 
Latest dividend: 0.033 per share ex-dividend date: Sep-20-2022
Risk Adjusted Returns v/s
Returns Beta

News
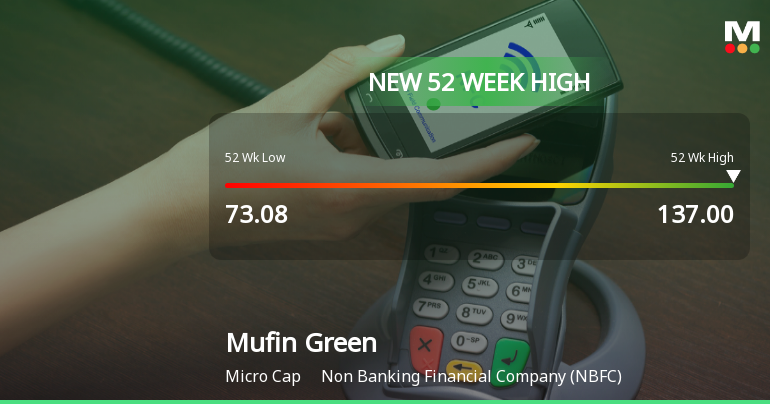
Broad-Based Technical Strength Lifts Mufin Green Finance Ltd to 52-Week High of Rs 137
Surging past its previous peak, Mufin Green Finance Ltd touched a fresh 52-week high of Rs 137 on 1 Jul 2026, marking a remarkable 76.76% gain over the past year. This milestone comes amid a backdrop of strong technical momentum and sustained upward price action that has outpaced the broader market's modest gains.
Read full news article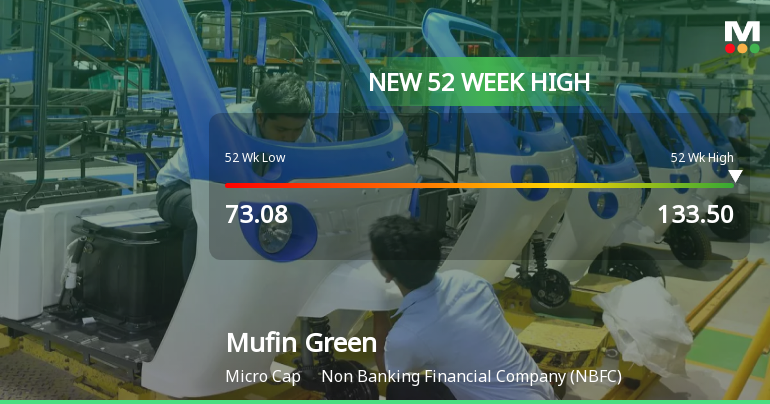
Broad-Based Technical Strength Lifts Mufin Green Finance Ltd to 52-Week High of Rs 133.5
With a robust 74.22% gain over the past year, Mufin Green Finance Ltd surged to a fresh 52-week high of Rs 133.5 on 30 Jun 2026, outpacing its sector and the broader market. This milestone caps a sustained rally fuelled by strong technical momentum and a series of bullish signals across multiple timeframes.
Read full news article
Mufin Green Finance Ltd is Rated Buy by MarketsMOJO
Mufin Green Finance Ltd is rated Buy by MarketsMOJO, with this rating last updated on 22 May 2026. While the rating change occurred on that date, the analysis and financial metrics discussed here reflect the company’s current position as of 28 June 2026, providing investors with the latest insights into its performance and outlook.
Read full news article Announcements
Corporate Actions

No Upcoming Board Meetings

Mufin Green Finance Ltd has declared 10% dividend, ex-date: 20 Sep 22

Mufin Green Finance Ltd has announced 1:2 stock split, ex-date: 13 Apr 23

Mufin Green Finance Ltd has announced 2:1 bonus issue, ex-date: 07 Jul 23

No Rights history available
Quality key factors
Valuation key factors
Technicals key factors
 Technical Indicator Scale: Bearish, Mildly Bearish, Sideways, Mildly Bullish, Bullish Turned
 Shareholding Snapshot : Mar 2026
Shareholding Compare (%holding)
Promoters
None
Held by 0 Schemes
Held by 12 FIIs (1.18%)
Hindon Mercantile Limited (44.53%)
Incofin India Progress Fund (7.31%)
27.87%
Quarterly Results Snapshot (Consolidated) - Mar'26 - QoQ

QoQ Growth in quarter ended Mar 2026 is 22.12% vs -0.99% in Dec 2025
QoQ Growth in quarter ended Mar 2026 is 58.20% vs 21.91% in Dec 2025
Half Yearly Results Snapshot (Standalone) - Sep'25

Growth in half year ended Sep 2025 is 27.46% vs 99.77% in Sep 2024
Growth in half year ended Sep 2025 is -1.55% vs 38.47% in Sep 2024
Nine Monthly Results Snapshot (Standalone) - Dec'25
YoY Growth in nine months ended Dec 2025 is 25.45% vs 82.96% in Dec 2024
YoY Growth in nine months ended Dec 2025 is 4.82% vs 36.47% in Dec 2024
Annual Results Snapshot (Consolidated) - Mar'26
YoY Growth in year ended Mar 2026 is 15.95% vs 85.45% in Mar 2025
YoY Growth in year ended Mar 2026 is 44.11% vs 22.10% in Mar 2025
About Mufin Green Finance Ltd

Company Coordinates


