
Compare Mukand with Similar Stocks
Dashboard
With a Operating Losses, the company has a Weak Long Term Fundamental Strength
- Poor long term growth as Net Sales has grown by an annual rate of 12.39% and Operating profit at 17.19% over the last 5 years
- Low ability to service debt as the company has a high Debt to EBITDA ratio of 9.92 times
The company has declared positive results in Mar'2026 after 4 consecutive negative quarters
With ROCE of 3.4, it has a Very Attractive valuation with a 1.2 Enterprise value to Capital Employed
Despite the size of the company, domestic mutual funds hold only 0% of the company
Stock DNA
Ferrous Metals
INR 2,025 Cr (Small Cap)
3.00
14
0.00%
1.09
39.69%
1.32
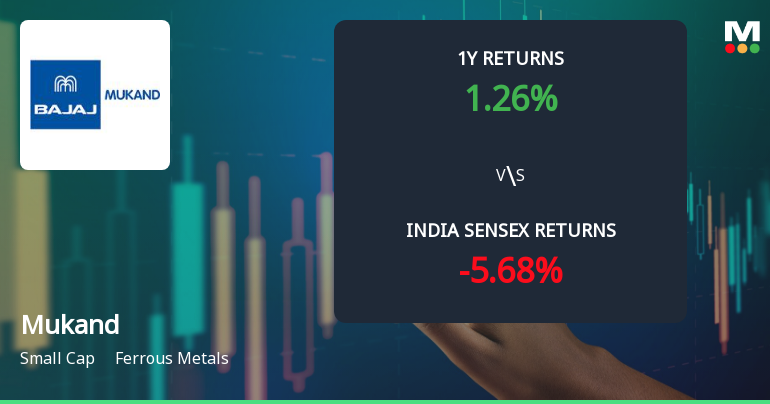
Total Returns (Price + Dividend) 
Latest dividend: 2 per share ex-dividend date: Jul-25-2025
Risk Adjusted Returns v/s
Returns Beta

News
Mukand Ltd Technical Momentum Shifts Signal Bullish Outlook Amid Market Volatility
Mukand Ltd, a small-cap player in the ferrous metals sector, has witnessed a notable shift in its technical momentum, upgrading its MarketsMOJO grade from Sell to Hold as of 22 April 2026. This change reflects improving price action and bullish signals across key technical indicators, suggesting a more optimistic near-term outlook despite broader sector headwinds and mixed market trends.
Read full news article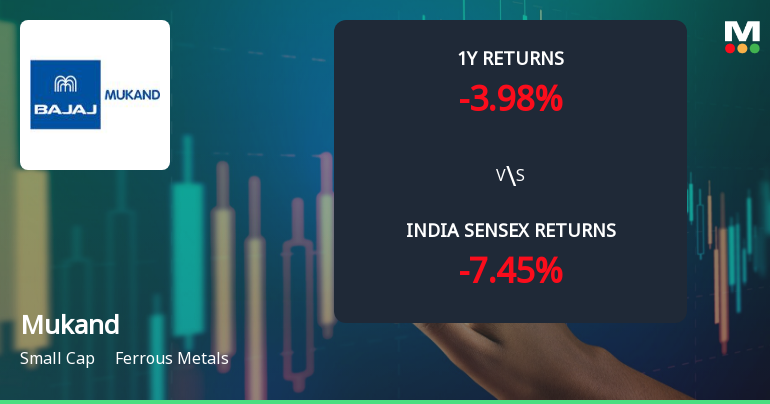
Mukand Ltd Technical Momentum Shifts Amid Mixed Market Signals
Mukand Ltd, a small-cap player in the ferrous metals sector, has experienced a nuanced shift in its technical momentum, reflecting a complex interplay of bullish and bearish signals across multiple timeframes. Recent technical parameter changes have prompted an upgrade in its MarketsMOJO grade from Sell to Hold, signalling cautious optimism amid mixed indicator readings.
Read full news article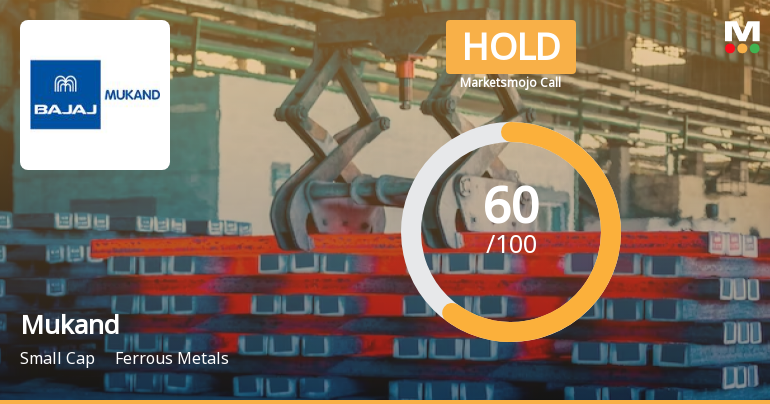
Mukand Ltd is Rated Hold by MarketsMOJO
Mukand Ltd is rated 'Hold' by MarketsMOJO, with this rating last updated on 15 May 2026. However, the analysis and financial metrics discussed here reflect the stock's current position as of 20 July 2026, providing investors with an up-to-date view of the company’s fundamentals, valuation, financial trends, and technical outlook.
Read full news article Announcements
Announcement under Regulation 30 (LODR)-Newspaper Publication
22-Jul-2026 | Source : BSENews Paper advertisement with respect to 88th Annual General Meeting.
Announcement Under Regulation (30 LODR)-Update (Letter To Shareholders In Accordance With Regulation 36(1)(B) Of SEBI (Listing Obligations And Disclosure Requirements) Regulations 2015.
22-Jul-2026 | Source : BSEPlease find enclosed herewith a copy of Letter to the shareholders providing the weblink including the exact path where complete details of the Annual Report 2025-26.
Intimation Of Record Date
21-Jul-2026 | Source : BSEIntimation of Record Date
Corporate Actions

12 Aug 2026

Mukand Ltd has declared 20% dividend, ex-date: 07 Aug 26

No Splits history available

No Bonus history available

Mukand Ltd has announced 1:1 rights issue, ex-date: 10 Feb 14
Quality key factors
Valuation key factors
Technicals key factors
 Technical Indicator Scale: Bearish, Mildly Bearish, Sideways, Mildly Bullish, Bullish Turned
 Shareholding Snapshot : Jun 2026
Shareholding Compare (%holding)
Promoters
None
Held by 5 Schemes (0.0%)
Held by 14 FIIs (0.25%)
Jamnalal Sons Private Limited (19.92%)
Siddhant Commercials Private Limited (2.48%)
15.57%
Quarterly Results Snapshot (Consolidated) - Mar'26 - QoQ

QoQ Growth in quarter ended Mar 2026 is -4.53% vs 14.53% in Dec 2025

QoQ Growth in quarter ended Mar 2026 is 5,309.16% vs 3.85% in Dec 2025
Half Yearly Results Snapshot (Consolidated) - Sep'25
Growth in half year ended Sep 2025 is -9.18% vs -8.63% in Sep 2024
Growth in half year ended Sep 2025 is -21.55% vs -8.57% in Sep 2024
Nine Monthly Results Snapshot (Consolidated) - Dec'25
YoY Growth in nine months ended Dec 2025 is -4.35% vs -3.88% in Dec 2024
YoY Growth in nine months ended Dec 2025 is -23.80% vs -12.34% in Dec 2024
Annual Results Snapshot (Consolidated) - Mar'26
YoY Growth in year ended Mar 2026 is -0.00% vs -5.50% in Mar 2025
YoY Growth in year ended Mar 2026 is 696.09% vs -26.92% in Mar 2025
About Mukand Ltd

Company Coordinates


