Murudesh.Ceramic

  • Market Cap: Micro Cap
  • Industry: Diversified consumer products
  • ISIN: INE692B01014
  • NSEID: MURUDCERA
  • BSEID: 515037
INR
31.90
0.83 (2.67%)
BSENSE

Aug 28, 02:36 PM

BSE+NSE Vol: 19.9 k

  • Price Points
  • Score
  • Mojo Parameters
  • Total Return
  • News and Corporate Actions
  • Key factors
  • Shareholding
  • Financials
  • CompanyCV
stock-summaryPrice Point
High/Low

1Day

52 Week

Valuation
Technical
Day's Volume

CASH

19.9 k (45.16%) Volume

Shareholding (Jun 2026)

FII

0.00%

Held by 0 FIIs

DII

0.00%

Held by 0 DIIs

Promoter

73.94%

Why is Murudeshwar Ceramics Ltd falling/rising?

28-Aug-2026

As of 27-Aug, Murudeshwar Ceramics Ltd's stock price is rising to 31.07, driven by strong performance against the Sensex and increased investor interest. The stock has outperformed its sector today and shows a positive short-term trend, despite being below longer-term moving averages.

As of 27-Aug, Murudeshwar Ceramics Ltd's stock price is rising, currently at 31.07, with a change of 0.07 (0.23%) increase. This upward movement can be attributed to several factors. Over the past week, the stock has outperformed the benchmark Sensex, gaining 1.87% while the Sensex declined by 0.78%. Additionally, the stock has shown a positive performance today, outperforming its sector by 0.95%. <BR><BR>Investor participation has also increased, as indicated by a delivery volume of 16.6k on 26 August, which is up by 17.68% compared to the 5-day average delivery volume. This suggests a growing interest among investors, contributing to the stock's rise. Furthermore, the stock's price is currently higher than its 5-day and 20-day moving averages, indicating a short-term positive trend, although it remains below the longer-term moving averages of 50, 100, and 200 days. <BR><BR>Overall, the combination of recent positive performance relative to the market, increased investor participation, and favorable short-term moving averages supports the stock's rising price.

View full answer

Should I buy, sell or hold Murudeshwar Ceramics Ltd?

25-Aug-2026

Who are in the management team of Murudesh.Ceramic?

14-Aug-2026

The management team of Murudesh.Ceramic includes Chairman & Managing Director Satish R Shetty, Directors Sunil R Shetty and Naveen R Shetty, along with several independent directors and key officers, responsible for the company's operations and strategic direction.

The management team of Murudesh.Ceramic includes the following individuals:<BR><BR>1. **Satish R Shetty** - Chairman & Managing Director<BR>2. **Sunil R Shetty** - Director<BR>3. **Naveen R Shetty** - Director<BR>4. **S S Hiremath** - Independent Director<BR>5. **Annappayya Kundapur** - Independent Director<BR>6. **Keremane Sankappa Shetty** - Independent Director<BR>7. **Sarvani Alva** - Independent Director<BR>8. **Karan Satish Shetty** - Whole-time Director<BR>9. **Ashok Kumar** - Company Secretary & Compliance Officer<BR>10. **Sathya Murthy Padaki** - Independent Director<BR><BR>This team is responsible for overseeing the company's operations and strategic direction.

View full answer

What does Murudesh.Ceramic do?

14-Aug-2026

Murudeshwar Ceramics Ltd manufactures vitrified and ceramic tiles and is categorized as a micro-cap company with a market cap of INR 189 Cr. As of June 2026, it reported net sales of 50 Cr and a net profit of 1 Cr.

Overview:<BR>Murudeshwar Ceramics Ltd is a pioneer in manufacturing world-class vitrified and ceramic tiles, operating within the diversified consumer products industry and categorized as a micro-cap company.<BR><BR>History:<BR>Murudeshwar Ceramics Ltd was incorporated in 1983 and was promoted by R N Shetty and Associates along with the KSIIDC. The latest quarterly results reported net sales and profit for June 2026.<BR><BR>Financial Snapshot:<BR>- Net Sales: 50 Cr (Quarterly Results - Jun 2026)<BR>- Net Profit: 1 Cr (Quarterly Results - Jun 2026)<BR>- Market Cap: INR 189 Cr (Micro Cap)<BR><BR>Key Metrics:<BR>- P/E: 19.00<BR>- Industry P/E: 30<BR>- Dividend Yield: 1.59%<BR>- Debt Equity: 0.36<BR>- Return on Equity: 2.84%<BR>- Price to Book: 0.50<BR><BR>Contact Details:<BR>Address: 604/B Murudeshwar Bhavan, Gokul Road Hubli Karnataka : 580030<BR>Tel: 91-0836-2331615-18<BR>Email: investor@naveentile.com<BR>Website: http://www.naveentile.com

View full answer

Who are the peers of the Murudesh.Ceramic?

14-Aug-2026

Murudesh.Ceramic's peers include Exxaro Tiles, Pil Italica Life, Superhouse Ltd, and others. It has average management risk and a 1-year return of -29.57%, better than Pil Italica Life but worse than Superhouse Ltd's 1.92%.

Peers: The peers of Murudesh.Ceramic are Exxaro Tiles, Pil Italica Life, Superhouse Ltd, Eleganz Interior, Master Component, EMA Partners, Polysil Irrigati, Rajshree Polypac, and Cool Caps.<BR><BR>Quality Snapshot: Excellent management risk is observed at Eleganz Interior and Master Component, while Good management risk is found at EMA Partners and Superhouse Ltd. Average management risk is present at Murudesh.Ceramic, while Below Average management risk is noted for Exxaro Tiles, Pil Italica Life, Polysil Irrigati, Rajshree Polypac, and Cool Caps. Growth is Excellent at Master Component, Good at Eleganz Interior and EMA Partners, Average at Murudesh.Ceramic and Superhouse Ltd, and Below Average at Exxaro Tiles, Pil Italica Life, Polysil Irrigati, Rajshree Polypac, and Cool Caps. Capital Structure is Excellent at Eleganz Interior and EMA Partners, Good at Pil Italica Life and Master Component, Average at Superhouse Ltd, and Below Average at Exxaro Tiles, Murudesh.Ceramic, Polysil Irrigati, Rajshree Polypac, and Cool Caps.<BR><BR>Return Snapshot: The peer with the highest 1-year return is Superhouse Ltd at 1.92%, while the peer with the lowest is Pil Italica Life at -41.67%. Murudesh.Ceramic's 1-year return of -29.57% is better than Pil Italica Life's but worse than Superhouse Ltd's. Additionally, Exxaro Tiles, Pil Italica Life, Murudesh.Ceramic, Polysil Irrigati, Rajshree Polypac, and Cool Caps all have negative six-month returns.

View full answer

How big is Murudesh.Ceramic?

14-Aug-2026

As of 14th August, Murudeshwar Ceramics Ltd has a market capitalization of 189.00 Cr, with recent net sales of 209.41 Cr and a net profit of 9.67 Cr.

As of 14th August, Murudeshwar Ceramics Ltd has a market capitalization of 189.00 Cr and is classified as a Micro Cap company.<BR><BR>In the latest four quarters, the company reported Net Sales of 209.41 Cr and a Net Profit of 9.67 Cr.<BR><BR>The latest annual period for the balance sheet is March 2025, with Shareholder's Funds amounting to 372.08 Cr and Total Assets of 569.92 Cr.

View full answer

Are Murudeshwar Ceramics Ltd latest results good or bad?

02-Jun-2026

Murudeshwar Ceramics Ltd's latest results are concerning, with a 51.38% decline in net profit and a 5.66% drop in net sales year-on-year, alongside rising input costs and a high effective tax rate of 62.47%, indicating significant operational challenges and poor financial performance.

The latest results for Murudeshwar Ceramics Ltd are concerning. In the quarter ending March 2026, the company reported a consolidated net profit of ₹1.58 crores, which is a significant decline of 51.38% year-on-year. Additionally, net sales decreased by 5.66% compared to the same quarter last year, indicating weakening demand or competitive pressures in the ceramic tiles market.<BR><BR>The operating margin also fell to 15.50%, down from 16.64% a year earlier, reflecting rising input costs and competitive pricing challenges. Furthermore, the effective tax rate was alarmingly high at 62.47%, which is far above the corporate tax norm and has raised questions about the sustainability of the company's earnings.<BR><BR>Overall, the financial performance highlights serious operational challenges, including a heavy reliance on non-operating income, which constituted a large portion of profits. Given these factors, the results can be characterized as poor, raising concerns about the company's ability to generate sustainable profitability moving forward.

View full answer

Is Murudesh.Ceramic overvalued or undervalued?

14-Nov-2025

As of November 13, 2025, Murudesh.Ceramic is considered attractive but undervalued, with a PE ratio of 24.26, a price-to-book value of 0.65, and an EV to EBITDA ratio of 10.75, significantly lower than peers like Kajaria Ceramics and Cera Sanitary, while also underperforming the Sensex with a year-to-date return of -21.12%.

As of 13 November 2025, the valuation grade for Murudesh.Ceramic has moved from very attractive to attractive, indicating a shift in perception regarding its investment potential. The company is currently assessed as undervalued, given its price-to-earnings (PE) ratio of 24.26, a price-to-book value of 0.65, and an EV to EBITDA ratio of 10.75. These ratios suggest that the company is trading at a discount compared to its earnings and book value.<BR><BR>In comparison with peers, Murudesh.Ceramic's PE ratio is significantly lower than that of Kajaria Ceramics, which stands at 46.03, and Cera Sanitary, which has a PE of 30.01. This highlights Murudesh.Ceramic's relative undervaluation in the market. Additionally, the company's recent stock performance has lagged behind the Sensex, with a year-to-date return of -21.12% compared to the Sensex's 8.11%, reinforcing the notion that the stock may be undervalued.

View full answer

How has been the historical performance of Murudesh.Ceramic?

13-Nov-2025

Murudesh.Ceramic has demonstrated consistent growth in net sales and profitability over the past five years, with net sales increasing from INR 80.49 crore in March 2021 to INR 202.86 crore in March 2025, and profit after tax rising from a loss of INR 11.87 crore to a profit of INR 9.92 crore. Despite increased leverage, the company has maintained positive cash flow from operating activities.

Answer:<BR>The historical performance of Murudesh.Ceramic shows a consistent growth trajectory in net sales and profitability over the past five years.<BR><BR>Breakdown:<BR>Murudesh.Ceramic's net sales have steadily increased from INR 80.49 crore in March 2021 to INR 202.86 crore in March 2025. This growth is reflected in the total operating income, which rose from INR 80.49 crore in March 2021 to INR 202.86 crore in March 2025. The company's operating profit (PBDIT) also demonstrated a positive trend, climbing from INR 10.23 crore in March 2021 to INR 39.51 crore in March 2025, despite fluctuations in operating profit margins. Profit before tax improved significantly from a loss of INR 15.95 crore in March 2021 to a profit of INR 11.95 crore in March 2025, while profit after tax reached INR 9.92 crore in March 2025, up from a loss of INR 11.87 crore in March 2021. The company's total assets increased from INR 475.74 crore in March 2022 to INR 569.92 crore in March 2025, indicating a solid asset base. However, total debt has also risen from INR 81.04 crore in March 2021 to INR 104.45 crore in March 2025, reflecting increased leverage. Cash flow from operating activities has remained positive, although net cash inflow/outflow showed some volatility, with a net outflow of INR 11 crore in March 2025. Overall, Murudesh.Ceramic has shown resilience and growth in its financial performance over the years.

View full answer

How has been the historical performance of Murudesh.Ceramic?

12-Nov-2025

Murudesh.Ceramic has shown consistent growth in net sales and profitability over the past five years, with net sales rising from INR 80.49 crore in March 2021 to INR 202.86 crore in March 2025, and profit after tax improving from a loss of INR 11.87 crore to a profit of INR 9.92 crore. The company's total assets increased from INR 475.74 crore to INR 569.92 crore during the same period.

Answer:<BR>The historical performance of Murudesh.Ceramic shows a consistent growth trajectory in net sales and profitability over the past five years.<BR><BR>Breakdown:<BR>Murudesh.Ceramic's net sales increased from INR 80.49 crore in March 2021 to INR 202.86 crore in March 2025, reflecting a strong upward trend. Total operating income followed a similar pattern, rising from INR 80.49 crore to INR 202.86 crore during the same period. The company's operating profit (PBDIT) also showed significant growth, climbing from INR 10.23 crore in March 2021 to INR 39.51 crore in March 2025. Profit before tax improved from a loss of INR 15.95 crore in March 2021 to a profit of INR 11.95 crore in March 2025, while profit after tax rose from a loss of INR 11.87 crore to a profit of INR 9.92 crore over the same timeframe. The earnings per share (EPS) increased from a loss of INR 2.27 to a profit of INR 1.63, indicating improved shareholder value. Total assets grew from INR 475.74 crore in March 2021 to INR 569.92 crore in March 2025, while total liabilities also increased from INR 81.04 crore to INR 104.45 crore, reflecting the company's expansion. Cash flow from operating activities showed a positive trend, reaching INR 28 crore in March 2025, although the net cash inflow/outflow turned negative at INR -11 crore for the same period. Overall, Murudesh.Ceramic has demonstrated robust growth in sales and profitability, alongside a steady increase in assets and liabilities.

View full answer

When is the next results date for Murudesh.Ceramic?

29-Oct-2025

The next results date for Murudesh.Ceramic is 12 November 2025.

The next results date for Murudesh.Ceramic is scheduled for 12 November 2025.

View full answer

What is the technical trend for Murudesh.Ceramic?

09-Jun-2025

As of May 12, 2025, Murudesh.Ceramic's technical trend is mildly bearish, with daily moving averages indicating short-term weakness, while weekly indicators show a mildly bullish stance, and monthly indicators remain bearish.

As of 12 May 2025, the technical trend for Murudesh.Ceramic has changed from bearish to mildly bearish. The weekly MACD and KST indicate a mildly bullish stance, while the monthly MACD and KST remain bearish. The daily moving averages are mildly bearish, suggesting short-term weakness. The Bollinger Bands show a bullish signal on the weekly chart but are mildly bearish on the monthly chart. Overall, the current technical stance is mildly bearish, with key indicators being the daily moving averages and the monthly MACD.

View full answer

Who are the top shareholders of the Murudesh.Ceramic?

06-Jun-2025

The top shareholders of Murudesh.Ceramic include Murudeshwar Power Corporation Private Limited with 38.26%, individual investors with 23.52%, and Sangeetha S as the highest public shareholder at 1.9%. There are no pledged promoter holdings reported.

The top shareholders of Murudesh.Ceramic include the promoters, with Murudeshwar Power Corporation Private Limited holding the largest stake at 38.26%. Individual investors collectively own 23.52% of the shares, while the highest public shareholder is Sangeetha S, who holds 1.9%. Additionally, there are three mutual funds and one foreign institutional investor, but they hold negligible stakes at 0.0%. There are no pledged promoter holdings reported.

View full answer

Has Murudesh.Ceramic declared dividend?

06-Jun-2025

Yes, Murudeshwar Ceramics Ltd has declared a 5% dividend, amounting to 0.5 per share, with an ex-date of September 14, 2023. However, the dividend yield is 0%, and total returns have varied significantly across different periods.

Murudeshwar Ceramics Ltd has declared a 5% dividend.<BR><BR>Dividend Details:<BR>- Percentage announced: 5%<BR>- Amount per share: 0.5<BR>- Ex-date: 14 Sep 23<BR><BR>Dividend Yield: 0%<BR><BR>Total Returns by Period:<BR>In the last 6 months, the price return was -20.3%, the dividend return was 0%, resulting in a total return of -20.3%.<BR><BR>Over the past year, the price return was -1.94%, the dividend return was 0%, leading to a total return of -1.94%.<BR><BR>In the 2-year period, the price return was -5.96%, the dividend return was 1.08%, culminating in a total return of -4.88%.<BR><BR>For the 3-year period, the price return was 63.47%, the dividend return was 2.27%, resulting in a total return of 65.74%.<BR><BR>In the last 4 years, the price return was 69.94%, the dividend return was 1.77%, leading to a total return of 71.71%.<BR><BR>Over the past 5 years, the price return was 192.1%, the dividend return was 2.89%, resulting in a total return of 194.99%.<BR><BR>Overall, while Murudeshwar Ceramics Ltd has declared a dividend, the dividend yield remains at 0%. The total returns over various periods show significant fluctuations, with a notable increase in returns over longer periods despite recent declines in shorter terms.

View full answer
iScoreScore
Click here to find our call on this stock
Strong Sell
Sell
Hold
Buy
Strong Buy

Dashboard

1

Weak Long Term Fundamental Strength with an average Return on Capital Employed (ROCE) of 4.41%

  • Poor long term growth as Operating profit has grown by an annual rate 18.70% of over the last 5 years
  • Company's ability to service its debt is weak with a poor EBIT to Interest (avg) ratio of 1.49
2

Negative results in Jun 26

3

Below par performance in long term as well as near term

stock-summaryMojo Parameters

Mojo Parameters

Loading Valuation Snapshot...

Stock DNA

stock-summary
Industry

Diversified consumer products

stock-summary
Market cap

INR 193 Cr (Micro Cap)

stock-summary
P/E

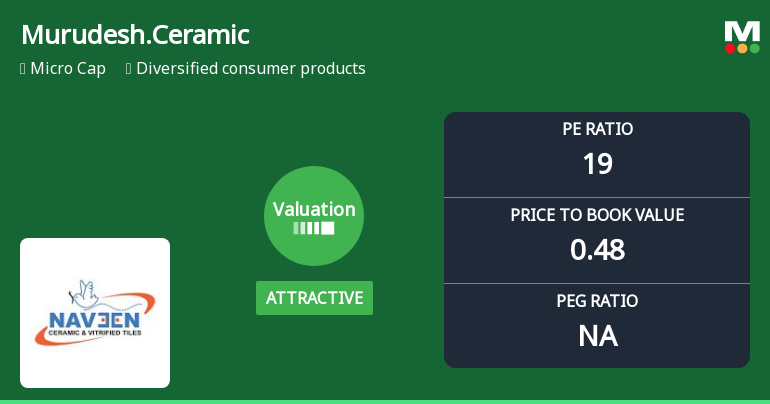
19.00

stock-summary
Industry P/E

29

stock-summary
Dividend Yield

0.00%

stock-summary
Debt Equity

0.36

stock-summary
Return on Equity

2.84%

stock-summary
Price to Book

0.49

Revenue and Profits:
Net Sales:
50 Cr
(Quarterly Results - Jun 2026)
Net Profit:
1 Cr
stock-summaryTotal Returns
Total Returns (Price + Dividend) stock-summary
Dividend Yield (0%)
TimePeriod
Price Return
Dividend Return
Total Return
3 Months
-8.62%
0%
-8.62%
6 Months
-2.54%
0%
-2.54%
1 Year
-25.64%
0%
-25.64%
2 Years
-49.53%
0.81%
-48.72%
3 Years
-19.93%
2.45%
-17.48%
4 Years
14.75%
3.46%
18.21%
5 Years
27.86%
3.85%
31.71%

Latest dividend: 0.5 per share ex-dividend date: Aug-14-2025

Risk Adjusted Returns v/s stock-summary
Returns Beta
Icon
Beta has not been calculated since enough price history is not available
stock-summaryNews & Corporate Actions

Announcements stock-summary

Notice Of 43Rd Annual General Meeting Scheduled To Be Held On Friday 18Th September 2026 At 3:00 P.M. For The Financial Year Ended 31St March 2026.

18-Aug-2026 | Source : BSE

Reg. 34 (1) Annual Report.

18-Aug-2026 | Source : BSE

We wish to inform you that the 43rd Annual General Meeting of the Company will be held on Friday 18th September 2026 at 3:00 P.M. at Hotel Naveen Unkal Lake Hubballi - Dharwad Highway Bairidevarkoppa Hubballi - 580025 Karnataka.

Intimation For The 43Rd Annual General Meeting (AGM) Scheduled To Be Held On Friday 18Th September 2026 At 3:00 P.M. At Hotel Naveen Unkal Lake Hubballi-Dharwad Highway Bairidevarkoppa Hubballi-580025 Karnataka

13-Aug-2026 | Source : BSE

Please find attached the details of 43rd Annual General Meeting scheduled to be held on 18th September 2026 at 3:00 P.M.

Corporate Actions stock-summary

stock-summary
BOARD MEETING

No Upcoming Board Meetings

stock-summary
DIVIDEND

Murudeshwar Ceramics Ltd has declared 5% dividend, ex-date: 14 Aug 25

stock-summary
SPLITS

No Splits history available

stock-summary
BONUS

No Bonus history available

stock-summary
RIGHTS

Murudeshwar Ceramics Ltd has announced 1:1 rights issue, ex-date: 19 Oct 10

stock-summaryKey Factors

Quality key factors stock-summary

Factor
Value
Sales Growth (5y)
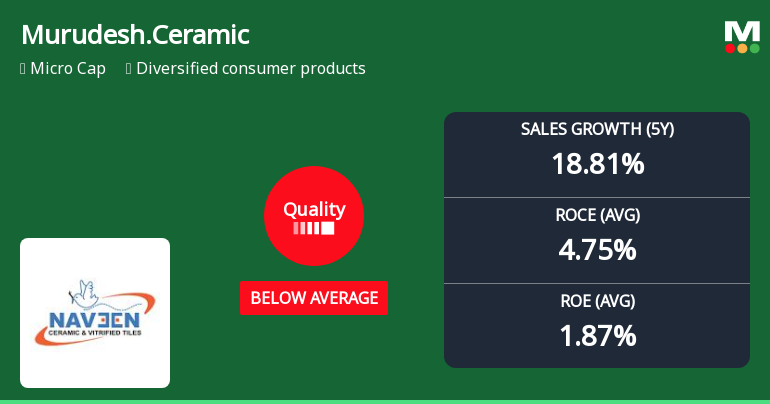
18.81%
EBIT Growth (5y)
18.70%
EBIT to Interest (avg)
1.49
Debt to EBITDA (avg)
3.61
Net Debt to Equity (avg)
0.36
Sales to Capital Employed (avg)
0.38
Tax Ratio
28.31%
Dividend Payout Ratio
0
Pledged Shares
0
Institutional Holding
0.01%
ROCE (avg)
4.75%
ROE (avg)
1.87%

Valuation key factors

Factor
Value
P/E Ratio
19
Industry P/E
29
Price to Book Value
0.49
EV to EBIT
18.51
EV to EBITDA
9.84
EV to Capital Employed
0.63
EV to Sales
1.55
PEG Ratio
NA
Dividend Yield
NA
ROCE (Latest)
3.20%
ROE (Latest)
2.84%

Technicals key factors

Indicator
Weekly
Monthly
MACD
Mildly Bullish
Bearish
RSI
No Signal
No Signal
Bollinger Bands
Mildly Bearish
Mildly Bearish
Moving Averages
Bearish (Daily)
KST
Bearish
Bearish
Dow Theory
Mildly Bearish
Mildly Bearish
OBV
Mildly Bearish
No Trend
stock-summary Technical Indicator Scale: Bearish, Mildly Bearish, Sideways, Mildly Bullish, Bullish  Turned 
stock-summaryShareholding
Shareholding Snapshot : Jun 2026stock-summary
Shareholding Compare (%holding) stock-summary
Majority shareholders

Promoters

Pledged Promoter Holdings

None

Mutual Funds

Held by 3 Schemes (0.0%)

FIIs

Held by 0 FIIs

Promoter with highest holding

Murudeshwar Power Corporation Private Limited (38.26%)

Highest Public shareholder

Sangeetha S (1.9%)

Individual Investors Holdings

23.61%

stock-summaryFinancial
[
  {
    "link": "quarterly",
    "btn_text": "All Quarterly Results",
    "header": "Quarterly Results Snapshot (Consolidated) - Jun'26 - YoY",
    "rhs": [
      {
        "prefix": "Net Sales ",
        "suffix": "YoY Growth in quarter ended Jun 2026 is 8.54% vs 6.17% in Jun 2025",
        "dir": 1
      },
      {
        "prefix": "Consolidated Net Profit ",
        "suffix": "YoY Growth in quarter ended Jun 2026 is -58.03% vs -3.98% in Jun 2025",
        "dir": -1
      }
    ],
    "table": {
      "header": [
        "Jun'26",
        "Jun'25",
        "Change(%)"
      ],
      "body": [
        {
          "field": "Net Sales",
          "val1": "50.09",
          "val2": "46.15",
          "chgp": "8.54%",
          "chgp_class": "positive"
        },
        {
          "field": "Operating Profit (PBDIT) excl Other Income",
          "val1": "9.57",
          "val2": "8.06",
          "chgp": "18.73%",
          "chgp_class": "positive"
        },
        {
          "field": "Interest",
          "val1": "3.39",
          "val2": "2.86",
          "chgp": "18.53%",
          "chgp_class": "negative"
        },
        {
          "field": "Exceptional Items",
          "val1": "0.00",
          "val2": "0.00",
          "chgp": "",
          "chgp_class": "neutral"
        },
        {
          "field": "Consolidate Net Profit",
          "val1": "0.81",
          "val2": "1.93",
          "chgp": "-58.03%",
          "chgp_class": "negative"
        },
        {
          "field": "Operating Profit Margin (Excl OI)",
          "val1": "19.11%",
          "val2": "17.46%",
          "chgp": "1.65%",
          "chgp_class": "positive"
        }
      ]
    }
  },
  {
    "link": "half-yearly",
    "btn_text": "All Half Yearly Results",
    "header": "Half Yearly Results Snapshot (Consolidated) - Sep'25",
    "rhs": [
      {
        "prefix": "Net Sales ",
        "suffix": " Growth in half year ended Sep 2025 is 6.26% vs 3.24% in Sep 2024",
        "dir": 1
      },
      {
        "prefix": "Consolidated Net Profit ",
        "suffix": " Growth in half year ended Sep 2025 is 4.07% vs 105.00% in Sep 2024",
        "dir": -1
      }
    ],
    "table": {
      "header": [
        "Sep'25",
        "Sep'24",
        "Change(%)"
      ],
      "body": [
        {
          "field": "Net Sales",
          "val1": "91.72",
          "val2": "86.32",
          "chgp": "6.26%",
          "chgp_class": "positive"
        },
        {
          "field": "Operating Profit (PBDIT) excl Other Income",
          "val1": "15.06",
          "val2": "15.58",
          "chgp": "-3.34%",
          "chgp_class": "negative"
        },
        {
          "field": "Interest",
          "val1": "5.64",
          "val2": "6.16",
          "chgp": "-8.44%",
          "chgp_class": "positive"
        },
        {
          "field": "Exceptional Items",
          "val1": "0.00",
          "val2": "0.00",
          "chgp": "",
          "chgp_class": "neutral"
        },
        {
          "field": "Consolidate Net Profit",
          "val1": "5.12",
          "val2": "4.92",
          "chgp": "4.07%",
          "chgp_class": "positive"
        },
        {
          "field": "Operating Profit Margin (Excl OI)",
          "val1": "16.42%",
          "val2": "18.05%",
          "chgp": "-1.63%",
          "chgp_class": "negative"
        }
      ]
    }
  },
  {
    "link": "nine-monthly",
    "btn_text": "All Nine Monthly Results",
    "header": "Nine Monthly Results Snapshot (Consolidated) - Dec'25",
    "rhs": [
      {
        "prefix": "Net Sales ",
        "suffix": "YoY Growth in nine months ended Dec 2025 is 4.66% vs 1.35% in Dec 2024",
        "dir": 1
      },
      {
        "prefix": "Consolidated Net Profit ",
        "suffix": "YoY Growth in nine months ended Dec 2025 is 39.76% vs 61.92% in Dec 2024",
        "dir": -1
      }
    ],
    "table": {
      "header": [
        "Dec'25",
        "Dec'24",
        "Change(%)"
      ],
      "body": [
        {
          "field": "Net Sales",
          "val1": "142.83",
          "val2": "136.47",
          "chgp": "4.66%",
          "chgp_class": "positive"
        },
        {
          "field": "Operating Profit (PBDIT) excl Other Income",
          "val1": "21.76",
          "val2": "23.56",
          "chgp": "-7.64%",
          "chgp_class": "negative"
        },
        {
          "field": "Interest",
          "val1": "8.34",
          "val2": "9.01",
          "chgp": "-7.44%",
          "chgp_class": "positive"
        },
        {
          "field": "Exceptional Items",
          "val1": "0.00",
          "val2": "0.00",
          "chgp": "",
          "chgp_class": "neutral"
        },
        {
          "field": "Consolidate Net Profit",
          "val1": "9.21",
          "val2": "6.59",
          "chgp": "39.76%",
          "chgp_class": "positive"
        },
        {
          "field": "Operating Profit Margin (Excl OI)",
          "val1": "15.23%",
          "val2": "17.26%",
          "chgp": "-2.03%",
          "chgp_class": "negative"
        }
      ]
    }
  },
  {
    "link": "annual",
    "btn_text": "All Annual Results",
    "header": "Annual Results Snapshot (Consolidated) - Mar'26",
    "rhs": [
      {
        "prefix": "Net Sales ",
        "suffix": "YoY Growth in year ended Mar 2026 is 1.29% vs 8.88% in Mar 2025",
        "dir": -1
      },
      {
        "prefix": "Consolidated Net Profit ",
        "suffix": "YoY Growth in year ended Mar 2026 is 9.76% vs 87.79% in Mar 2025",
        "dir": -1
      }
    ],
    "table": {
      "header": [
        "Mar'26",
        "Mar'25",
        "Change(%)"
      ],
      "body": [
        {
          "field": "Net Sales",
          "val1": "205.48",
          "val2": "202.86",
          "chgp": "1.29%",
          "chgp_class": "positive"
        },
        {
          "field": "Operating Profit (PBDIT) excl Other Income",
          "val1": "31.49",
          "val2": "34.60",
          "chgp": "-8.99%",
          "chgp_class": "negative"
        },
        {
          "field": "Interest",
          "val1": "12.39",
          "val2": "13.06",
          "chgp": "-5.13%",
          "chgp_class": "positive"
        },
        {
          "field": "Exceptional Items",
          "val1": "0.00",
          "val2": "0.00",
          "chgp": "",
          "chgp_class": "neutral"
        },
        {
          "field": "Consolidate Net Profit",
          "val1": "10.80",
          "val2": "9.84",
          "chgp": "9.76%",
          "chgp_class": "positive"
        },
        {
          "field": "Operating Profit Margin (Excl OI)",
          "val1": "15.33%",
          "val2": "17.06%",
          "chgp": "-1.73%",
          "chgp_class": "negative"
        }
      ]
    }
  }
]

Quarterly Results Snapshot (Consolidated) - Jun'26 - YoYstock-summary

Jun'26
Jun'25
Change(%)
Net Sales
50.09
46.15
8.54%
Operating Profit (PBDIT) excl Other Income
9.57
8.06
18.73%
Interest
3.39
2.86
18.53%
Exceptional Items
0.00
0.00
Consolidate Net Profit
0.81
1.93
-58.03%
Operating Profit Margin (Excl OI)
19.11%
17.46%
1.65%
Values in Rs Cr.
Direction Arrows
Net Sales

YoY Growth in quarter ended Jun 2026 is 8.54% vs 6.17% in Jun 2025

Direction Arrows
Consolidated Net Profit

YoY Growth in quarter ended Jun 2026 is -58.03% vs -3.98% in Jun 2025

Half Yearly Results Snapshot (Consolidated) - Sep'25stock-summary

Sep'25
Sep'24
Change(%)
Net Sales
91.72
86.32
6.26%
Operating Profit (PBDIT) excl Other Income
15.06
15.58
-3.34%
Interest
5.64
6.16
-8.44%
Exceptional Items
0.00
0.00
Consolidate Net Profit
5.12
4.92
4.07%
Operating Profit Margin (Excl OI)
16.42%
18.05%
-1.63%
Values in Rs Cr.
Direction Arrows
Net Sales

Growth in half year ended Sep 2025 is 6.26% vs 3.24% in Sep 2024

Direction Arrows
Consolidated Net Profit

Growth in half year ended Sep 2025 is 4.07% vs 105.00% in Sep 2024

Nine Monthly Results Snapshot (Consolidated) - Dec'25stock-summary

Dec'25
Dec'24
Change(%)
Net Sales
142.83
136.47
4.66%
Operating Profit (PBDIT) excl Other Income
21.76
23.56
-7.64%
Interest
8.34
9.01
-7.44%
Exceptional Items
0.00
0.00
Consolidate Net Profit
9.21
6.59
39.76%
Operating Profit Margin (Excl OI)
15.23%
17.26%
-2.03%
Values in Rs Cr.
Direction Arrows
Net Sales

YoY Growth in nine months ended Dec 2025 is 4.66% vs 1.35% in Dec 2024

Direction Arrows
Consolidated Net Profit

YoY Growth in nine months ended Dec 2025 is 39.76% vs 61.92% in Dec 2024

Annual Results Snapshot (Consolidated) - Mar'26stock-summary

Mar'26
Mar'25
Change(%)
Net Sales
205.48
202.86
1.29%
Operating Profit (PBDIT) excl Other Income
31.49
34.60
-8.99%
Interest
12.39
13.06
-5.13%
Exceptional Items
0.00
0.00
Consolidate Net Profit
10.80
9.84
9.76%
Operating Profit Margin (Excl OI)
15.33%
17.06%
-1.73%
Values in Rs Cr.
Direction Arrows
Net Sales

YoY Growth in year ended Mar 2026 is 1.29% vs 8.88% in Mar 2025

Direction Arrows
Consolidated Net Profit

YoY Growth in year ended Mar 2026 is 9.76% vs 87.79% in Mar 2025

stock-summaryCompany CV
About Murudeshwar Ceramics Ltd stock-summary
stock-summary
Murudeshwar Ceramics Ltd
Micro Cap
Diversified consumer products
Murudeshwar Ceramics Limited (MCL) is the pioneer in manufacturing world class Vitrified tiles and Ceramic tiles under the brand name "NAVEEN". The `Naveen Diamontile' tiles of various sizes, colors, designs are displayed in over 73 Company owned showrooms all over India. MCL was promoted in 1983 by R N Shetty and Associates along with the KSIIDC to manufacture 12,500 tons per annum (TPA) of glazed ceramic tiles, using the single-firing process, at Krishnapur (near Hubli), Karnataka.
Company Coordinates stock-summary
Company Details
604/B Murudeshwar Bhavan, Gokul Road Hubli Karnataka : 580030
stock-summary
Tel: 91-0836-2331615-18
stock-summary
investor@naveentile.com
Registrar Details
Canbank Computer Services Ltd , R & T Center , J. P. Royale, 1st Floor, No.218,2nd Main Sampige Road, Malleshwaram, Bangalore