
Compare Music Broadcast with Similar Stocks
Dashboard
With a Operating Losses, the company has a Weak Long Term Fundamental Strength
- Company's ability to service its debt is weak with a poor EBIT to Interest (avg) ratio of -4.51
- The company has reported losses. Due to this company has reported negative ROCE
The company has declared Negative results for the last 5 consecutive quarters
Risky - Negative EBITDA
Underperformed the market in the last 1 year
Stock DNA
Media & Entertainment
INR 207 Cr (Micro Cap)
NA (Loss Making)
20
0.00%
-0.18
-11.97%
0.47
Total Returns (Price + Dividend) 
Music Broadcast for the last several years.
Risk Adjusted Returns v/s
Returns Beta

News

Music Broadcast Ltd is Rated Strong Sell
Music Broadcast Ltd is rated Strong Sell by MarketsMOJO, with this rating last updated on 10 Oct 2024. However, the analysis and financial metrics discussed here reflect the stock’s current position as of 11 June 2026, providing investors with an up-to-date view of the company’s fundamentals, valuation, financial trend, and technical outlook.
Read full news article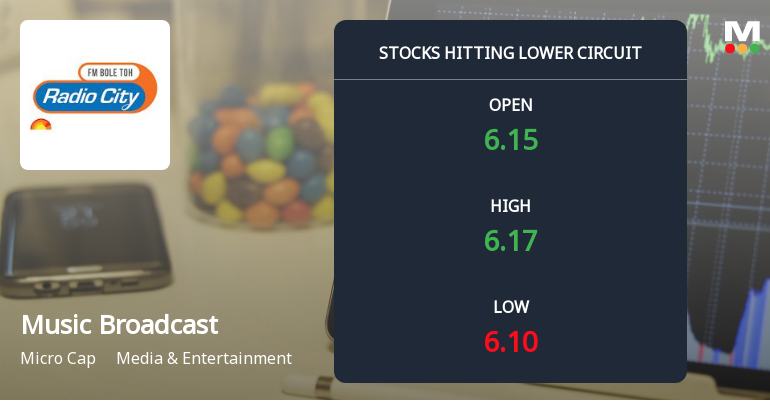
Music Broadcast Ltd Locks at Lower Circuit With 5% Loss — Sellers Queue, No Buyers in Sight
At Rs 5.79, sellers were still queuing — but there were no buyers willing to take the other side. Music Broadcast Ltd locked at its lower circuit of 5% on 2 Jun 2026, with unfilled sell orders and a frozen price, signalling a day of pronounced selling pressure.
Read full news article
Music Broadcast Ltd is Rated Strong Sell
Music Broadcast Ltd is rated Strong Sell by MarketsMOJO, with this rating last updated on 10 Oct 2024. However, the analysis and financial metrics discussed here reflect the company’s current position as of 31 May 2026, providing investors with an up-to-date view of its fundamentals, returns, and overall market standing.
Read full news article Announcements
Announcement under Regulation 30 (LODR)-Analyst / Investor Meet - Outcome
25-May-2026 | Source : BSETranscript of Investor Meet
Announcement under Regulation 30 (LODR)-Investor Presentation
22-May-2026 | Source : BSEInvestor Presentation on Financial Results for the quarter and year ended March 31 2026
Announcement under Regulation 30 (LODR)-Analyst / Investor Meet - Outcome
22-May-2026 | Source : BSEConcall Audio Recording
Corporate Actions

No Upcoming Board Meetings

No Dividend history available

Music Broadcast Ltd has announced 2:10 stock split, ex-date: 20 Feb 19

Music Broadcast Ltd has announced 1:10 bonus issue, ex-date: 13 Jan 23

No Rights history available
Quality key factors
Valuation key factors
Technicals key factors
 Technical Indicator Scale: Bearish, Mildly Bearish, Sideways, Mildly Bullish, Bullish Turned
 Shareholding Snapshot : Mar 2026
Shareholding Compare (%holding)
Promoters
None
Held by 0 Schemes
Held by 1 FIIs (0.0%)
Jagran Prakashan Limited (74.05%)
Lrsd Securities Private Limited (3.74%)
18.34%
Quarterly Results Snapshot (Standalone) - Mar'26 - YoY

YoY Growth in quarter ended Mar 2026 is -25.39% vs -12.71% in Mar 2025

YoY Growth in quarter ended Mar 2026 is -26.11% vs -1,380.47% in Mar 2025
Half Yearly Results Snapshot (Standalone) - Sep'25
Growth in half year ended Sep 2025 is -23.82% vs 8.50% in Sep 2024
Growth in half year ended Sep 2025 is -1,633.90% vs -54.62% in Sep 2024
Nine Monthly Results Snapshot (Standalone) - Dec'25
YoY Growth in nine months ended Dec 2025 is -25.67% vs 8.38% in Dec 2024
YoY Growth in nine months ended Dec 2025 is -228.16% vs 8.27% in Dec 2024
Annual Results Snapshot (Standalone) - Mar'26
YoY Growth in year ended Mar 2026 is -25.61% vs 2.60% in Mar 2025
YoY Growth in year ended Mar 2026 is -57.57% vs -594.74% in Mar 2025
About Music Broadcast Ltd

Company Coordinates


