
Compare N G Industries with Similar Stocks
Dashboard
Weak Long Term Fundamental Strength with a 8.30% CAGR growth in Operating Profits over the last 5 years
- Company's ability to service its debt is weak with a poor EBIT to Interest (avg) ratio of 1.35
- The company has been able to generate a Return on Capital Employed (avg) of 4.56% signifying low profitability per unit of total capital (equity and debt)
Negative results in Mar 26
Consistent Underperformance against the benchmark over the last 3 years
Stock DNA
Healthcare Services
INR 39 Cr (Micro Cap)
22.00
66
3.11%
0.01
5.15%
1.13
Total Returns (Price + Dividend) 
Latest dividend: 3.5 per share ex-dividend date: Sep-19-2025
Risk Adjusted Returns v/s
Returns Beta

News

N G Industries Ltd Valuation Shifts Amid Mixed Market Performance
N G Industries Ltd, a micro-cap player in the Healthcare Services sector, has seen a notable shift in its valuation parameters, moving from an attractive to a fair rating. Despite a recent day gain of 3.15%, the company’s price-to-earnings (P/E) and price-to-book value (P/BV) ratios now suggest a more tempered price attractiveness relative to its historical averages and peer group. This article analyses the valuation changes, compares N G Industries with its sector peers, and assesses the implications for investors amid a challenging market backdrop.
Read full news article
N G Industries Ltd is Rated Strong Sell
N G Industries Ltd is rated Strong Sell by MarketsMOJO, with this rating last updated on 27 Oct 2025. However, the analysis and financial metrics presented here reflect the company’s current position as of 02 July 2026, providing investors with an up-to-date view of the stock’s fundamentals, valuation, financial trends, and technical outlook.
Read full news article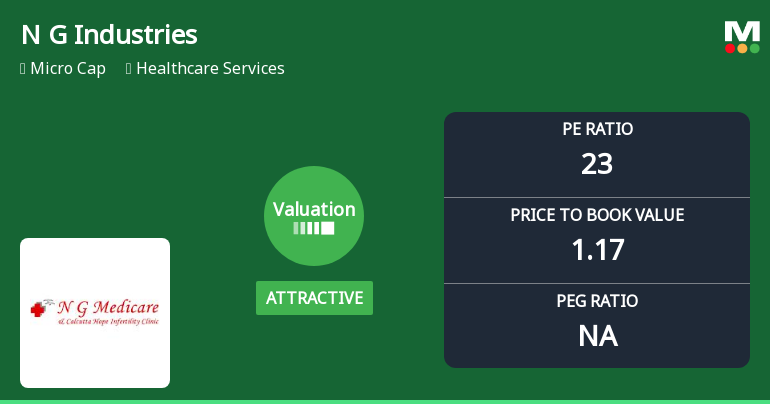
N G Industries Ltd Valuation Shifts Signal Renewed Price Attractiveness
N G Industries Ltd, a micro-cap player in the Healthcare Services sector, has seen a notable shift in its valuation parameters, moving from fair to attractive territory. Despite a challenging year-to-date performance with a 21.9% decline, the company’s price-to-earnings (P/E) and price-to-book value (P/BV) ratios now present a compelling case for value-oriented investors seeking opportunities in the healthcare space.
Read full news article Announcements
Compliances-Certificate under Reg. 74 (5) of SEBI (DP) Regulations 2018
11-Jul-2026 | Source : BSECertificate under Regulation 74(5) of +SEBI(DP) Regulations 2018
Announcement under Regulation 30 (LODR)-Newspaper Publication
09-Jul-2026 | Source : BSENewspaper Publication for transfer of unclaimed and unpaid Dividend for FY 2018-19 and corresponding shares to IEPF
Closure of Trading Window
26-Jun-2026 | Source : BSEClosure of Trading Window
Corporate Actions

No Upcoming Board Meetings

N G Industries Ltd has declared 35% dividend, ex-date: 19 Sep 25

No Splits history available

No Bonus history available

No Rights history available
Quality key factors
Valuation key factors
Technicals key factors
 Technical Indicator Scale: Bearish, Mildly Bearish, Sideways, Mildly Bullish, Bullish Turned
 Shareholding Snapshot : Mar 2026
Shareholding Compare (%holding)
Promoters
None
Held by 0 Schemes
Held by 0 FIIs
Ritu Goenka (20.89%)
Satish Kantilal Bora (1.43%)
23.48%
Quarterly Results Snapshot (Standalone) - Mar'26 - QoQ

QoQ Growth in quarter ended Mar 2026 is 1.63% vs 5.93% in Dec 2025

QoQ Growth in quarter ended Mar 2026 is 64.29% vs -2.33% in Dec 2025
Half Yearly Results Snapshot (Standalone) - Sep'25
Growth in half year ended Sep 2025 is -4.08% vs -8.80% in Sep 2024
Growth in half year ended Sep 2025 is -82.08% vs 29.59% in Sep 2024
Nine Monthly Results Snapshot (Standalone) - Dec'25
YoY Growth in nine months ended Dec 2025 is -0.33% vs -5.70% in Dec 2024
YoY Growth in nine months ended Dec 2025 is -89.77% vs 228.06% in Dec 2024
Annual Results Snapshot (Standalone) - Mar'26
YoY Growth in year ended Mar 2026 is -0.97% vs -1.95% in Mar 2025
YoY Growth in year ended Mar 2026 is -77.65% vs 53.88% in Mar 2025
About N G Industries Ltd

Company Coordinates


