
Compare N G Industries with Similar Stocks
Dashboard
Weak Long Term Fundamental Strength with a 8.30% CAGR growth in Operating Profits over the last 5 years
- Company's ability to service its debt is weak with a poor EBIT to Interest (avg) ratio of 1.35
- The company has been able to generate a Return on Capital Employed (avg) of 4.56% signifying low profitability per unit of total capital (equity and debt)
Negative results in Mar 26
Below par performance in long term as well as near term
Stock DNA
Healthcare Services
INR 40 Cr (Micro Cap)
23.00
60
2.97%
0.01
5.15%
1.18
Total Returns (Price + Dividend) 
Latest dividend: 3.5 per share ex-dividend date: Sep-19-2025
Risk Adjusted Returns v/s
Returns Beta

News

N G Industries Ltd Reports Mixed Quarterly Results Amidst Challenging Market Conditions
N G Industries Ltd, a micro-cap player in the Healthcare Services sector, reported its quarterly results for March 2026, revealing a nuanced financial performance that marks a shift from a negative to a flat financial trend. Despite some record quarterly earnings metrics, the company continues to face challenges in profitability and operational efficiency, reflected in its deteriorating returns and valuation metrics.
Read full news article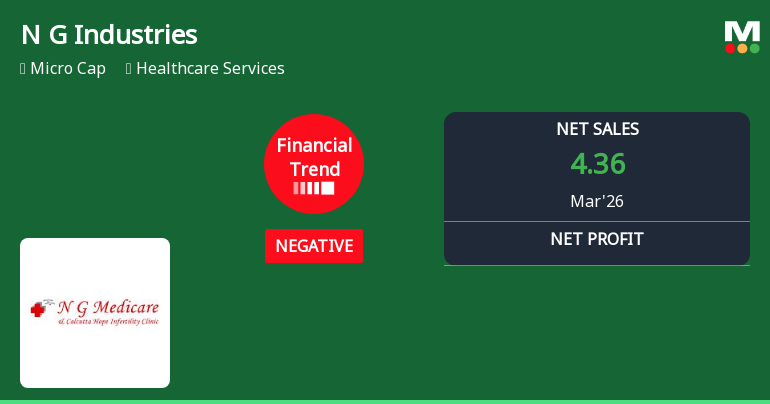
N G Industries Ltd Reports Mixed Quarterly Results Amid Negative Financial Trend
N G Industries Ltd, a micro-cap player in the healthcare services sector, has reported its March 2026 quarterly results reflecting a mixed performance with key profit metrics reaching new highs, yet overall financial trends turning negative. Despite a strong uptick in quarterly earnings per share and profit before tax, the company’s broader financial health indicators and recent returns signal caution for investors.
Read full news article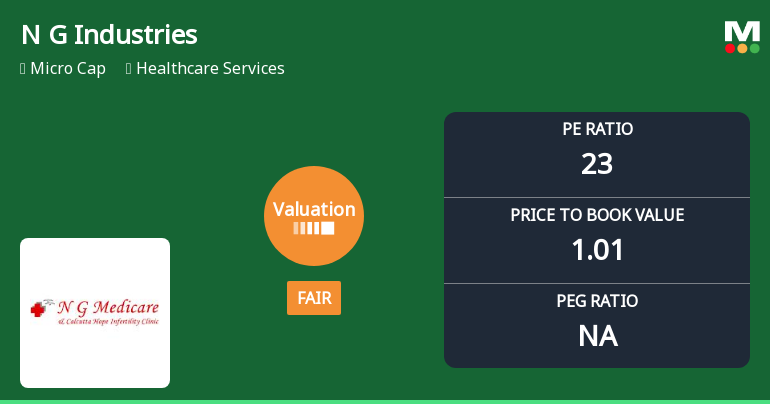
N G Industries Ltd Valuation Shifts Signal Renewed Price Attractiveness
N G Industries Ltd, a micro-cap player in the healthcare services sector, has witnessed a notable shift in its valuation parameters, moving from a very expensive rating to a fair valuation. Despite a recent downgrade in its overall Mojo Grade to Strong Sell, the company’s price-to-earnings (P/E) and price-to-book value (P/BV) ratios now suggest a more attractive entry point relative to its historical levels and peer group. This article analyses the evolving valuation landscape, market performance, and comparative metrics to provide investors with a comprehensive view of the stock’s current standing.
Read full news article Announcements
Announcement under Regulation 30 (LODR)-Newspaper Publication
01-Jun-2026 | Source : BSENewspaper publication
Compliances-Reg.24(A)-Annual Secretarial Compliance
29-May-2026 | Source : BSEAnnual Secretarial Compliance Report for the year 31st March 2026
Board Meeting Intimation for Consideration And Approval Of 1. Audited Financial Results Of The Company For The Quarter And Year Ended 31St March 2026 And 2. Dividend For The Financial Year Ended 31St March 2026 Subject To Approval Of The Shareholders At T
18-May-2026 | Source : BSENG Industries Ltd-has informed BSE that the meeting of the Board of Directors of the Company is scheduled on 28/05/2026 inter alia to consider and approve 1. Audited Financial Results Of The Company For The Quarter And Year Ended 31St March 2026 And 2. Dividend For The Financial Year Ended 31St March 2026 Subject To Approval Of The Shareholders At The Ensuing AGM.
Corporate Actions

No Upcoming Board Meetings

N G Industries Ltd has declared 35% dividend, ex-date: 19 Sep 25

No Splits history available

No Bonus history available

No Rights history available
Quality key factors
Valuation key factors
Technicals key factors
 Technical Indicator Scale: Bearish, Mildly Bearish, Sideways, Mildly Bullish, Bullish Turned
 Shareholding Snapshot : Mar 2026
Shareholding Compare (%holding)
Promoters
None
Held by 0 Schemes
Held by 0 FIIs
Ritu Goenka (20.89%)
Satish Kantilal Bora (1.43%)
23.48%
Quarterly Results Snapshot (Standalone) - Mar'26 - QoQ

QoQ Growth in quarter ended Mar 2026 is 1.63% vs 5.93% in Dec 2025

QoQ Growth in quarter ended Mar 2026 is 64.29% vs -2.33% in Dec 2025
Half Yearly Results Snapshot (Standalone) - Sep'25
Growth in half year ended Sep 2025 is -4.08% vs -8.80% in Sep 2024
Growth in half year ended Sep 2025 is -82.08% vs 29.59% in Sep 2024
Nine Monthly Results Snapshot (Standalone) - Dec'25
YoY Growth in nine months ended Dec 2025 is -0.33% vs -5.70% in Dec 2024
YoY Growth in nine months ended Dec 2025 is -89.77% vs 228.06% in Dec 2024
Annual Results Snapshot (Standalone) - Mar'26
YoY Growth in year ended Mar 2026 is -0.97% vs -1.95% in Mar 2025
YoY Growth in year ended Mar 2026 is -77.65% vs 53.88% in Mar 2025
About N G Industries Ltd

Company Coordinates


