
Compare Naga Dhunseri with Similar Stocks
Dashboard
With a Operating Losses, the company has a Weak Long Term Fundamental Strength
- Poor long term growth as Operating profit has grown by an annual rate of -14.84%
Flat results in Mar 26
With ROE of -1.2, it has a Very Expensive valuation with a 0.2 Price to Book Value
Below par performance in long term as well as near term
Stock DNA
Non Banking Financial Company (NBFC)
INR 241 Cr (Micro Cap)
NA (Loss Making)
20
0.10%
0.19
-1.22%
0.19
Total Returns (Price + Dividend) 
Latest dividend: 2.5 per share ex-dividend date: Aug-07-2025
Risk Adjusted Returns v/s
Returns Beta

News

Naga Dhunseri Group Ltd is Rated Strong Sell
Naga Dhunseri Group Ltd is rated Strong Sell by MarketsMOJO, with this rating last updated on 01 June 2026. However, the analysis and financial metrics discussed here reflect the stock’s current position as of 11 June 2026, providing investors with an up-to-date view of the company’s fundamentals, valuation, financial trend, and technical outlook.
Read full news article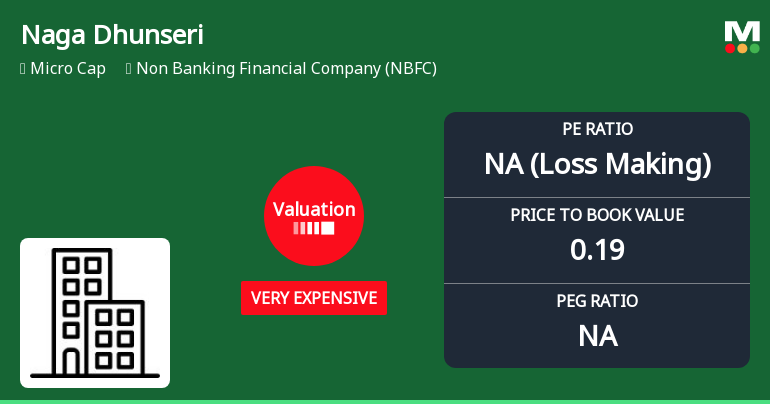
Naga Dhunseri Group Ltd Valuation Shifts: From Attractive to Very Expensive Amid Market Pressure
Naga Dhunseri Group Ltd, a micro-cap player in the Non Banking Financial Company (NBFC) sector, has witnessed a significant shift in its valuation parameters, moving from a previously attractive valuation to being classified as very expensive. This change has coincided with a downgrade in its Mojo Grade from Sell to Strong Sell as of 1 June 2026, reflecting growing concerns about its price attractiveness relative to peers and historical benchmarks.
Read full news articleAre Naga Dhunseri Group Ltd latest results good or bad?
The latest financial results for Naga Dhunseri Group Ltd for the quarter ending March 2026 reveal significant operational challenges. The company reported consolidated net sales of ₹37.51 crores, reflecting a year-on-year decline of 32.84%. This marks a stark contrast to the previous year, where the company experienced substantial growth. The consolidated net profit also deteriorated, resulting in a loss of ₹26.75 crores, which is a notable increase in losses compared to the same quarter last year. The operating profit before depreciation, interest, tax, and other income (PBDIT) turned sharply negative at ₹-67.23 crores, indicating severe operational distress. The operating margin plummeted to -179.23%, underscoring the challenges faced by the company in maintaining profitability. Additionally, employee costs remained elevated, contributing to the overall financial strain. Despite these quarterly setbacks...
Read full news article Announcements
Naga Dhunseri Group Limited - Outcome of Board Meeting
05-Dec-2019 | Source : NSENaga Dhunseri Group Limited has informed the Exchange regarding Board meeting held on December 05, 2019.
Naga Dhunseri Group Limited - Updates
08-Nov-2019 | Source : NSENaga Dhunseri Group Limited has informed the Exchange regarding 'updation regarding submission of financial results'.
Naga Dhunseri Group Limited - Updates
17-Oct-2019 | Source : NSENaga Dhunseri Group Limited has informed the Exchange regarding 'Certificate under Regulation 74(5) of SEBI (Depositories and Participants) Regulations, 2018 for the Quarter ended 30th September, 2019'.
Corporate Actions

No Upcoming Board Meetings

Naga Dhunseri Group Ltd has declared 25% dividend, ex-date: 07 Aug 25

No Splits history available

No Bonus history available

No Rights history available
Quality key factors
Valuation key factors
Technicals key factors
 Technical Indicator Scale: Bearish, Mildly Bearish, Sideways, Mildly Bullish, Bullish Turned
 Shareholding Snapshot : Mar 2026
Shareholding Compare (%holding)
Promoters
None
Held by 0 Schemes
Held by 0 FIIs
Mint Investments Limited (33.22%)
Vayjayanti Pugalia (3.12%)
16.89%
Quarterly Results Snapshot (Consolidated) - Mar'26 - YoY

YoY Growth in quarter ended Mar 2026 is -32.84% vs 1,562.20% in Mar 2025

YoY Growth in quarter ended Mar 2026 is -399.07% vs -1,629.03% in Mar 2025
Half Yearly Results Snapshot (Consolidated) - Sep'25
Growth in half year ended Sep 2025 is 2,181.24% vs -8.01% in Sep 2024
Growth in half year ended Sep 2025 is -12.10% vs 12.17% in Sep 2024
Nine Monthly Results Snapshot (Consolidated) - Dec'25
YoY Growth in nine months ended Dec 2025 is 2,824.31% vs -43.37% in Dec 2024
YoY Growth in nine months ended Dec 2025 is -56.30% vs 16.69% in Dec 2024
Annual Results Snapshot (Consolidated) - Mar'26
YoY Growth in year ended Mar 2026 is 558.10% vs 142.17% in Mar 2025
YoY Growth in year ended Mar 2026 is -127.05% vs 1.92% in Mar 2025
About Naga Dhunseri Group Ltd

Company Coordinates


