
Compare Nag. Agri Tech. with Similar Stocks
Stock DNA
Other Agricultural Products
INR 158 Cr (Micro Cap)
89.00
38
0.00%
0.00
25.34%
23.53
Total Returns (Price + Dividend) 
Nag. Agri Tech. for the last several years.
Risk Adjusted Returns v/s
Returns Beta

News
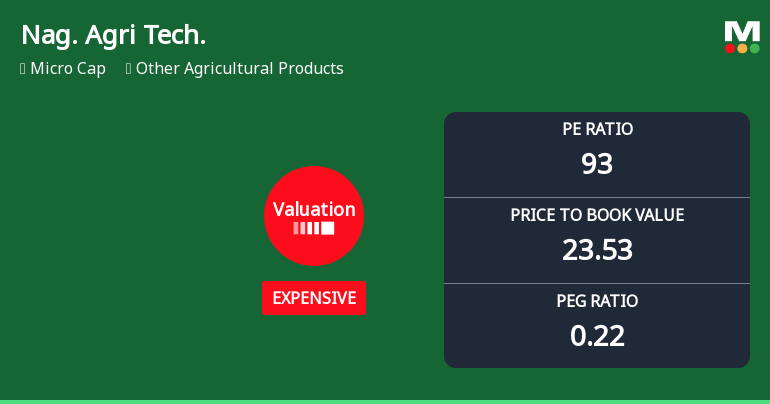
Nagarjuna Agri Tech Ltd Valuation Shifts Amidst Market Volatility
Nagarjuna Agri Tech Ltd has experienced a notable shift in its valuation parameters, moving from a very expensive to an expensive rating, reflecting a subtle change in price attractiveness. Despite a strong one-week rally of 21.48%, the stock remains a micro-cap with a challenging valuation profile, underscored by a high price-to-earnings (P/E) ratio of 92.88 and a price-to-book value (P/BV) of 23.53. This article analyses the implications of these valuation changes in the context of historical trends, peer comparisons, and broader market performance.
Read full news article
Nagarjuna Agri Tech Q4 FY26: Revival Sparks Hope But Valuation Concerns Persist
Nagarjuna Agri Tech Ltd., a micro-cap player in the agricultural products sector, reported a dramatic operational turnaround in Q4 FY26 (Mar'26), swinging back to profitability with net profit of ₹1.15 crores after posting a loss of ₹0.45 crores in the previous quarter. The company's market capitalisation stands at ₹151.00 crores, with shares trading at ₹51.74 as of June 02, 2026.
Read full news article
Nagarjuna Agri Tech Ltd Reports Positive Financial Trend Amid Micro-Cap Challenges
Nagarjuna Agri Tech Ltd has demonstrated a notable turnaround in its financial performance for the quarter ended March 2026, shifting from a flat to a positive growth trajectory. Despite operating within the micro-cap segment and facing sectoral headwinds, the company posted its highest quarterly profits and sales in recent periods, signalling potential for recovery amid a challenging agricultural products industry.
Read full news article Announcements
Announcement under Regulation 30 (LODR)-Change in Corporate Office Address
01-Jun-2026 | Source : BSEKindly find enclosed the letter in regard to change in Corporate address of the Company.
Announcement under Regulation 30 (LODR)-Newspaper Publication
01-Jun-2026 | Source : BSEKindly find enclosed the extracts of the newspaper advertisement for the audited financials results for the quarter and year ended March 31 2026.
Audited Financial Standalone & Consolidated Results Along With Auditors Report Thereon For The Financial Year Ended On 31St March 2026.
29-May-2026 | Source : BSEAudited Financial Results.
Corporate Actions

No Upcoming Board Meetings

No Dividend history available

No Splits history available

No Bonus history available

No Rights history available
Quality key factors
Valuation key factors
Technicals key factors
 Technical Indicator Scale: Bearish, Mildly Bearish, Sideways, Mildly Bullish, Bullish Turned
 Shareholding Snapshot : Mar 2026
Shareholding Compare (%holding)
Non Institution
23.628
Held by 1 Schemes (0.16%)
Held by 0 FIIs
Rachna Suman Shaw (35.09%)
Nirmal Kumar Bhakat (15.8%)
31.1%
Quarterly Results Snapshot (Standalone) - Mar'26 - YoY

YoY Growth in quarter ended Mar 2026 is 0.00% vs -100.00% in Mar 2025
YoY Growth in quarter ended Mar 2026 is 2,940.00% vs 101.93% in Mar 2025
Half Yearly Results Snapshot (Standalone) - Sep'25
Growth in half year ended Sep 2025 is 2,02,700.00% vs -99.00% in Sep 2024
Growth in half year ended Sep 2025 is 92.31% vs -95.17% in Sep 2024
Nine Monthly Results Snapshot (Standalone) - Dec'25
YoY Growth in nine months ended Dec 2025 is 3,01,200.00% vs -99.42% in Dec 2024
YoY Growth in nine months ended Dec 2025 is -87.80% vs -93.35% in Dec 2024
Annual Results Snapshot (Standalone) - Mar'26
YoY Growth in year ended Mar 2026 is 5,16,000.00% vs -99.60% in Mar 2025
YoY Growth in year ended Mar 2026 is 241.30% vs -87.15% in Mar 2025
About Nagarjuna Agri Tech Ltd

Company Coordinates


