
Compare Nagarjuna Fert. with Similar Stocks
Dashboard
With a Negative Book Value, the company has a Weak Long Term Fundamental Strength
- Low ability to service debt as the company has a high Debt to EBITDA ratio of -0.71 times
- The company has reported losses and also has negative networth. This is not a good sign for the investors. Either company will have to raise fresh capital or report profits to sustain going forward
Negative results in Dec 25
Risky - Negative EBITDA
37.58% of Promoter Shares are Pledged
Stock DNA
Fertilizers
INR 230 Cr (Micro Cap)
NA (Loss Making)
24
0.00%
-0.01
2.63%
-0.25
Total Returns (Price + Dividend) 
Nagarjuna Fert. for the last several years.
Risk Adjusted Returns v/s
Returns Beta

News

Nagarjuna Fertilizers & Chemicals Ltd is Rated Strong Sell
Nagarjuna Fertilizers & Chemicals Ltd is rated Strong Sell by MarketsMOJO. This rating was last updated on 02 Sep 2024. However, the analysis and financial metrics presented here reflect the company’s current position as of 29 May 2026, providing investors with an up-to-date view of its fundamentals, returns, and overall market standing.
Read full news article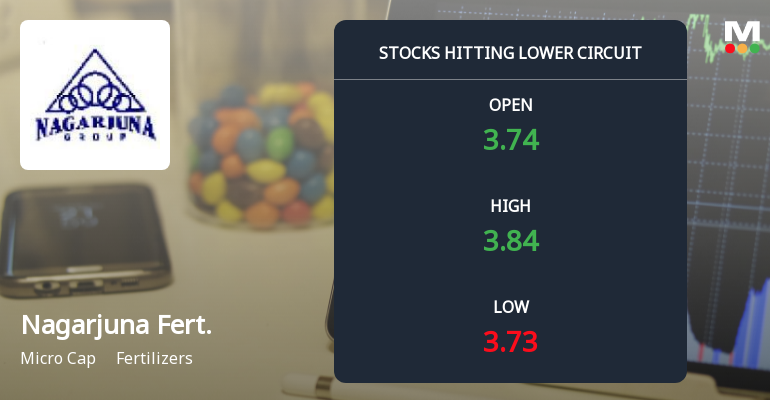
Below All Moving Averages and Now at Lower Circuit: Nagarjuna Fertilizers & Chemicals Ltd Loses 5% in a Single Session
At Rs 3.59, sellers were still queuing — but there were no buyers willing to take the other side. Nagarjuna Fertilizers & Chemicals Ltd locked at its lower circuit of 5% on 20 May 2026, with unfilled sell orders and a frozen price, signalling a pronounced imbalance in supply and demand.
Read full news article
Nagarjuna Fertilizers & Chemicals Ltd is Rated Strong Sell
Nagarjuna Fertilizers & Chemicals Ltd is rated Strong Sell by MarketsMOJO. This rating was last updated on 02 Sep 2024, reflecting a significant reassessment of the stock’s outlook. However, the analysis and financial metrics discussed below represent the company’s current position as of 18 May 2026, providing investors with an up-to-date perspective on its fundamentals, valuation, financial trend, and technical standing.
Read full news article Announcements
Delay In Submission Of Annual Financial Results
30-May-2026 | Source : BSEThe Company in terms of Regulation 33 of SEBI (LODR) Regulations 2015 (Listing Regulations) is obliged to submit its Audited Financial Results for the year ended March 31 2026 within 60 days from the end of the quarter i.e. on or before May 30 2026. The Company has faced unprecedented employee attrition in critical positions due to financial difficulties resulting in delays in preparation and finalization of periodical reporting. The Company is in the process of finalizing the Audited Financial Results for the year ended March 31 2026 and shall submit the same on or before June 15 2026.
Compliances-Certificate under Reg. 74 (5) of SEBI (DP) Regulations 2018
13-Apr-2026 | Source : BSEConfirmation certificate under Regulation 74(5) of SEBI (Depositories and Participants) Regulations 2018.
Closure of Trading Window
31-Mar-2026 | Source : BSEClosure or Trading window
Corporate Actions

No Upcoming Board Meetings

No Dividend history available

No Splits history available

No Bonus history available

No Rights history available
Quality key factors
Valuation key factors
Technicals key factors
 Technical Indicator Scale: Bearish, Mildly Bearish, Sideways, Mildly Bullish, Bullish Turned
 Shareholding Snapshot : Mar 2026
Shareholding Compare (%holding)
Promoters
37.5833
Held by 7 Schemes (0.0%)
Held by 5 FIIs (0.0%)
Agri Vestors Private Limited (45.44%)
National Insurance Company Limited (0.01%)
39.99%
Quarterly Results Snapshot (Consolidated) - Dec'25 - YoY

YoY Growth in quarter ended Dec 2025 is 105.01% vs -113.97% in Dec 2024

YoY Growth in quarter ended Dec 2025 is -118.63% vs 98.25% in Dec 2024
Half Yearly Results Snapshot (Consolidated) - Sep'25
Growth in half year ended Sep 2025 is -100.00% vs -63.63% in Sep 2024
Growth in half year ended Sep 2025 is -100.46% vs 360.93% in Sep 2024
Nine Monthly Results Snapshot (Consolidated) - Dec'25
YoY Growth in nine months ended Dec 2025 is -98.80% vs -80.49% in Dec 2024
YoY Growth in nine months ended Dec 2025 is -100.70% vs 324.57% in Dec 2024
Annual Results Snapshot (Consolidated) - Mar'25
YoY Growth in year ended Mar 2025 is -85.24% vs -15.54% in Mar 2024
YoY Growth in year ended Mar 2025 is 288.85% vs -42.24% in Mar 2024
About Nagarjuna Fertilizers & Chemicals Ltd

Company Coordinates


