
Compare Nagreeka Cap. with Similar Stocks
Stock DNA
Non Banking Financial Company (NBFC)
INR 32 Cr (Micro Cap)
4.00
NA
0.00%
3.32
26.00%
1.08
Total Returns (Price + Dividend) 
Nagreeka Cap. for the last several years.
Risk Adjusted Returns v/s
Returns Beta

News

Nagreeka Capital & Infrastructure Ltd Downgraded to Strong Sell Amid Weak Financials and Technical Setbacks
Nagreeka Capital & Infrastructure Ltd, a micro-cap player in the Non Banking Financial Company (NBFC) sector, has seen its investment rating downgraded from Sell to Strong Sell as of 23 June 2026. This revision reflects deteriorating technical indicators, disappointing quarterly financial results, and a weakening financial trend, despite an attractive valuation metric. The downgrade signals caution for investors amid ongoing operational challenges and sideways technical momentum.
Read full news article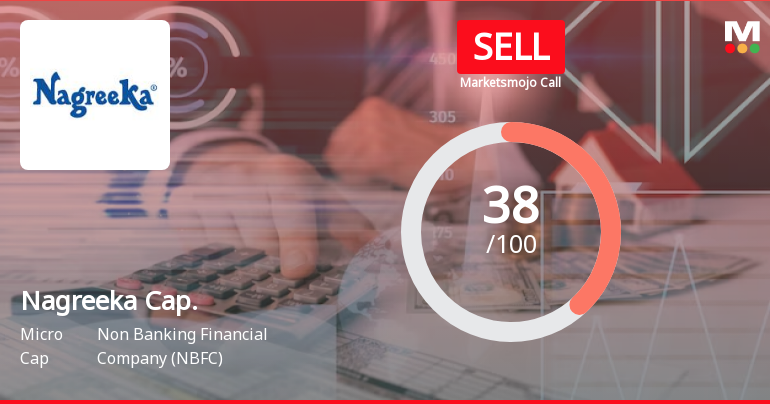
Nagreeka Capital & Infrastructure Ltd is Rated Sell
Nagreeka Capital & Infrastructure Ltd is rated 'Sell' by MarketsMOJO, with this rating last updated on 05 June 2026. However, the analysis and financial metrics discussed here reflect the stock's current position as of 19 June 2026, providing investors with an up-to-date view of its performance and outlook.
Read full news article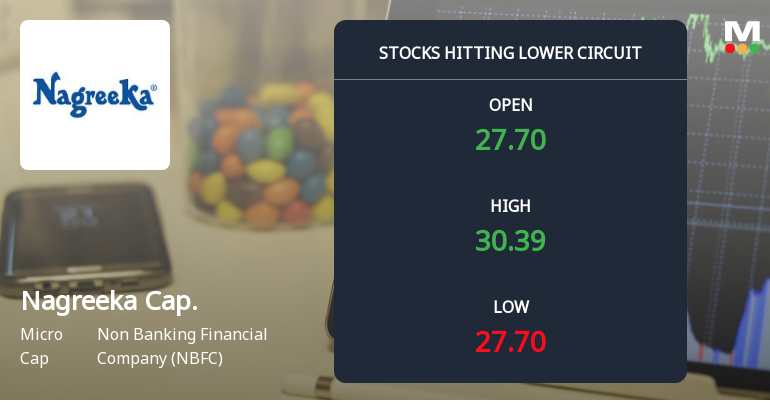
Nagreeka Capital & Infrastructure Ltd Locks at Lower Circuit With 5% Loss — Sellers Queue, No Buyers in Sight
At Rs 27.55, sellers were still queuing — but there were no buyers willing to take the other side. Nagreeka Capital & Infrastructure Ltd locked at its lower circuit of 5% on 17 Jun 2026, with unfilled sell orders and a frozen price.
Read full news article Announcements
Closure of Trading Window
24-Jun-2026 | Source : BSEThe trading window of the Company for dealing in securities of the company by all the designated person shall remain closed from 1st July 2026 till the conclusion of 48 hours after the declaration of the unaudited financial results for the quarter ended 30th June 2026
Compliances-Reg.24(A)-Annual Secretarial Compliance
30-May-2026 | Source : BSEAnnual Secretarial Compliance Report under Regulation 24A of Securities and Exchange Board of India
Announcement under Regulation 30 (LODR)-Newspaper Publication
29-May-2026 | Source : BSENewspaper advertisement under Regulation 47(1)(b) of the SEBI Regulations 2015
Corporate Actions

No Upcoming Board Meetings

No Dividend history available

No Splits history available

No Bonus history available

No Rights history available
Quality key factors
Valuation key factors
Technicals key factors
 Technical Indicator Scale: Bearish, Mildly Bearish, Sideways, Mildly Bullish, Bullish Turned
 Shareholding Snapshot : Mar 2026
Shareholding Compare (%holding)
Promoters
None
Held by 7 Schemes (0.03%)
Held by 1 FIIs (0.0%)
Dadra Eximp Private Limited (16.69%)
Lakecity Ventures Private Limited (6.31%)
26.77%
Quarterly Results Snapshot (Standalone) - Mar'26 - QoQ

QoQ Growth in quarter ended Mar 2026 is 49.93% vs 143.69% in Dec 2025
QoQ Growth in quarter ended Mar 2026 is -171.12% vs 14.24% in Dec 2025
Half Yearly Results Snapshot (Standalone) - Sep'25
Growth in half year ended Sep 2025 is -50.93% vs 45.69% in Sep 2024
Growth in half year ended Sep 2025 is -23.07% vs 142.36% in Sep 2024
Nine Monthly Results Snapshot (Standalone) - Dec'25
YoY Growth in nine months ended Dec 2025 is -14.91% vs 28.57% in Dec 2024
YoY Growth in nine months ended Dec 2025 is -11.51% vs 9.97% in Dec 2024
Annual Results Snapshot (Standalone) - Mar'26
YoY Growth in year ended Mar 2026 is -14.99% vs 20.64% in Mar 2025
YoY Growth in year ended Mar 2026 is -60.08% vs 39.13% in Mar 2025
About Nagreeka Capital & Infrastructure Ltd

Company Coordinates


