Nahar Capital

  • Market Cap: Micro Cap
  • Industry: Non Banking Financial Company (NBFC)
  • ISIN: INE049I01012
  • NSEID: NAHARCAP
  • BSEID: 532952
INR
255.09
-1.72 (-0.67%)
BSENSE

Aug 20, 03:30 PM

BSE+NSE Vol: 3.7 k

  • Price Points
  • Score
  • Mojo Parameters
  • Total Return
  • News and Corporate Actions
  • Key factors
  • Shareholding
  • Financials
  • CompanyCV
stock-summaryPrice Point
High/Low

1Day

52 Week

Valuation
Technical
Day's Volume

CASH

3.7 k (88.77%) Volume

Shareholding (Jun 2026)

FII

0.31%

Held by 7 FIIs

DII

0.37%

Held by 0 DIIs

Promoter

72.53%

Why is Nahar Capital & Financial Services Ltd falling/rising?

20-Aug-2026

As of 19-Aug, Nahar Capital & Financial Services Ltd's stock price is 256.81, down 0.36%. Despite a recent increase over the past week and month, declining investor participation and mixed moving average signals indicate potential challenges for the stock's short-term performance.

As of 19-Aug, Nahar Capital & Financial Services Ltd's stock price is currently at 256.81, reflecting a decrease of 0.94, or 0.36%. The stock's performance today is in line with the sector, but it has shown a decline in investor participation, with a delivery volume of 2.62k on 18 August, which is down by 42.19% compared to the 5-day average delivery volume. <BR><BR>Over the past week, the stock has increased by 0.26%, while the benchmark Sensex has decreased by 1.46%. In the last month, the stock has risen by 4.18%, contrasting with a 1.05% decline in the Sensex. However, year-to-date, the stock is down by 0.38%, while the Sensex has fallen by 7.85%. Over the past year, Nahar Capital & Financial Services Ltd has seen a significant decline of 15.51%, compared to a smaller decline of 3.61% in the Sensex. <BR><BR>The stock is currently trading above its 20-day, 50-day, 100-day, and 200-day moving averages, but below its 5-day moving average, indicating mixed signals regarding its short-term performance. Despite being liquid enough for trading, the falling investor participation suggests a lack of strong buying interest, which could contribute to the stock's current downward movement.

View full answer

Who are in the management team of Nahar Capital?

14-Aug-2026

The management team of Nahar Capital includes Chairman Jawahar Lal Oswal, Managing Director Dinesh Oswal, and several non-executive and independent directors, ensuring a mix of executive leadership and independent oversight.

The management team of Nahar Capital includes the following individuals:<BR><BR>1. Jawahar Lal Oswal - Chairman & Non-Executive Director<BR>2. Dinesh Oswal - Executive Director / Managing Director / Promoter<BR>3. Kamal Oswal - Non-Executive Director<BR>4. Dinesh Gogna - Non-Executive Director<BR>5. S K Sharma - Non-Executive Director<BR>6. Manisha Gupta - Independent Non-Executive Director<BR>7. Vijay Asdhir - Independent Non-Executive Director<BR>8. Roshan Lal Behl - Independent Non-Executive Director<BR>9. Yash Paul Sachdeva - Independent Non-Executive Director<BR>10. Rajan Dhir - Independent Non-Executive Director<BR><BR>This diverse board brings a mix of executive and independent oversight to the company's governance.

View full answer

What does Nahar Capital do?

14-Aug-2026

Nahar Capital & Financial Services Ltd is a Non Banking Financial Company (NBFC) focused on investment and lending in the micro-cap market, with a market cap of INR 444 Cr and a net profit of 67 Cr as of June 2026. Key metrics include a P/E ratio of 4.00 and a dividend yield of 0.59%.

Overview:<BR>Nahar Capital & Financial Services Ltd is a Non Banking Financial Company (NBFC) operating in the micro-cap market, primarily engaged in investment and lending activities.<BR><BR>History:<BR>The company was incorporated in an unspecified year and has maintained its status as a Non Banking Financial Company. The latest quarterly results reported are for June 2026, showcasing net sales and profit figures.<BR><BR>Financial Snapshot:<BR>Net Sales: 9 Cr (Quarterly Results - Jun 2026) <BR>Net Profit: 67 Cr (Quarterly Results - Jun 2026) <BR>Market Cap: INR 444 Cr (Micro Cap)<BR><BR>Key Metrics:<BR>P/E: 4.00 <BR>Industry P/E: 21 <BR>Dividend Yield: 0.59% <BR>Debt Equity: 0.01 <BR>Return on Equity: 3.93% <BR>Price to Book: 0.27<BR><BR>Contact Details:<BR>Address: 375 Industrial Area A, Ludhiana Punjab: 141003 <BR>Tel: 91-161-2665000 <BR>Email: sencfs@owmnahar.com <BR>Website: http://www.owmnahar.com

View full answer

Who are the peers of the Nahar Capital?

14-Aug-2026

Nahar Capital's peers include Unifinz Capital, Purple Finance, NDL Ventures, Akme Fintrade, Muthoot Cap.Serv, MKVentures Cap., Moneyboxx Fin., Regency Fincorp, and Naperol Invest. Nahar Capital has below-average management risk and growth, with a 1-year return of -13.78%, compared to peers like Purple Finance, which has the highest return at 78.16%.

Peers: The peers of Nahar Capital are Unifinz Capital, Purple Finance, NDL Ventures, Akme Fintrade, Muthoot Cap.Serv, MKVentures Cap., Moneyboxx Fin., Regency Fincorp, and Naperol Invest.<BR><BR>Quality Snapshot: Excellent management risk is observed at Unifinz Capital and Naperol Invest, while Average management risk is found at MKVentures Cap. Below Average management risk is present at Nahar Capital, Purple Finance, NDL Ventures, Akme Fintrade, Muthoot Cap.Serv, Moneyboxx Fin., and Regency Fincorp. Excellent growth is noted at Unifinz Capital, Purple Finance, Akme Fintrade, Moneyboxx Fin., and Regency Fincorp, while Below Average growth is seen at Nahar Capital, NDL Ventures, Muthoot Cap.Serv, and MKVentures Cap. Excellent capital structure is shared by Unifinz Capital, Nahar Capital, Purple Finance, Akme Fintrade, Muthoot Cap.Serv, MKVentures Cap., Regency Fincorp, and Naperol Invest, while Below Average capital structure is found at NDL Ventures.<BR><BR>Return Snapshot: The peer with the highest 1-year return is Purple Finance at 78.16%, while the lowest is Moneyboxx Fin. at -24.85%. Nahar Capital's 1-year return is -13.78%, which is higher than Moneyboxx Fin. but lower than Purple Finance. Additionally, Moneyboxx Fin. and NDL Ventures have negative six-month returns.

View full answer

How big is Nahar Capital?

14-Aug-2026

As of 14th August, Nahar Capital & Financial Services Ltd has a market capitalization of 430.00 Cr, with recent Net Sales of 31.56 Cr and a Net Profit of 119.09 Cr. The latest balance sheet shows Shareholder's Funds of 1,563.99 Cr and Total Assets of 1,726.35 Cr.

As of 14th August, Nahar Capital & Financial Services Ltd has a market capitalization of 430.00 Cr, categorizing it as a Micro Cap company.<BR><BR>In the latest four quarters, Nahar Capital reported Net Sales of 31.56 Cr and a Net Profit of 119.09 Cr.<BR><BR>The latest annual period for the balance sheet is March 2025, showing Shareholder's Funds of 1,563.99 Cr and Total Assets of 1,726.35 Cr.

View full answer

Are Nahar Capital & Financial Services Ltd latest results good or bad?

06-Aug-2026

Nahar Capital & Financial Services Ltd's latest results show impressive short-term gains, with a 270.75% increase in net profit and a 65.61% rise in net sales. However, concerns about low return on equity and reliance on volatile income suggest caution for long-term investment.

Nahar Capital & Financial Services Ltd's latest results present a mixed picture. On one hand, the company reported a significant increase in consolidated net profit of ₹67.44 crores for Q1 FY27, reflecting a remarkable 270.75% growth quarter-on-quarter and an impressive 487.46% year-on-year. Additionally, net sales rose to ₹9.39 crores, marking a 19.92% increase from the previous quarter and a substantial 65.61% increase compared to the same quarter last year. The operating margin, excluding other income, also improved to 64.75%, up from 44.96% in the previous quarter.<BR><BR>However, these positive figures are overshadowed by several concerning factors. The company's return on equity (ROE) over the past five years stands at a low 5.88%, indicating weak capital efficiency. Furthermore, the stock has underperformed its peers in the non-banking financial company (NBFC) sector, declining 12.98% over the past year, which is significantly worse than the sector average.<BR><BR>The recent profit surge appears to be heavily influenced by volatile other income, rather than sustainable operational improvements, raising questions about the sustainability of this performance. The company's reliance on non-operating income for profitability and its historically weak capital efficiency suggest that while the quarterly results seem strong, they do not necessarily indicate a solid long-term investment opportunity.<BR><BR>In summary, while Nahar Capital's latest results show impressive short-term gains, the underlying issues regarding capital efficiency and reliance on volatile income sources suggest caution for potential investors.

View full answer

Should I buy, sell or hold Nahar Capital & Financial Services Ltd?

06-Aug-2026

When is the next results date for Nahar Capital & Financial Services Ltd?

28-Jan-2026

The next results date for Nahar Capital & Financial Services Ltd is 07 February 2026.

The next results date for Nahar Capital & Financial Services Ltd is scheduled for 07 February 2026.

View full answer

How has been the historical performance of Nahar Capital?

14-Nov-2025

Nahar Capital's historical performance shows fluctuating net sales and profits, with net sales rising to 26.18 Cr in Mar'25 but a decline in operating profit and profit before tax. Despite these challenges, consolidated net profit significantly increased to 49.81 Cr in Mar'25, while cash flow from operations remained negative.

Answer:<BR>The historical performance of Nahar Capital shows a fluctuating trend in net sales and profits over the years, with significant variations in profitability metrics.<BR><BR>Breakdown:<BR>Nahar Capital's net sales increased from 23.88 Cr in Mar'24 to 26.18 Cr in Mar'25, following a dip to 25.54 Cr in Mar'23 from 30.03 Cr in Mar'22. The total operating income mirrored this trend, reaching 26.18 Cr in Mar'25. Operating profit (PBDIT) excluding other income was 16.55 Cr in Mar'25, up from 15.42 Cr in Mar'24, while the overall operating profit (PBDIT) was 36.86 Cr in Mar'25, down from 43.32 Cr in Mar'24. Profit before tax also decreased to 35.35 Cr in Mar'25 from 42.14 Cr in Mar'24, leading to a profit after tax of 26.76 Cr, a decline from 38.95 Cr in the previous year. The consolidated net profit showed a significant increase to 49.81 Cr in Mar'25 from 11.77 Cr in Mar'24, despite the fluctuations in other profit metrics. The company's total assets rose to 1,726.35 Cr in Mar'25, up from 1,699.51 Cr in Mar'24, while total liabilities also increased to 1,726.35 Cr from 1,699.51 Cr. Cash flow from operating activities remained negative at 0.00 Cr in Mar'25, indicating challenges in generating cash from core operations. Overall, Nahar Capital's financial performance reflects a complex interplay of growth in sales and net profit against a backdrop of fluctuating operating profits and cash flow challenges.

View full answer

Who are the top shareholders of the Nahar Capital?

17-Jul-2025

The top shareholders of Nahar Capital include Nahar Poly Films Ltd with 39.48%, individual investors with 20.92%, and R A Max Private Limited at 2.7%. Additionally, there are minimal holdings from mutual funds and foreign institutional investors, with no pledged promoter holdings reported.

The top shareholders of Nahar Capital primarily consist of promoters, with Nahar Poly Films Ltd holding the largest stake at 39.48%. Additionally, there are individual investors who collectively hold 20.92% of the shares. Among public shareholders, R A Max Private Limited is the highest with a holding of 2.7%. The company also has some institutional involvement, with 3 mutual fund schemes holding 0.01% and 8 foreign institutional investors (FIIs) holding 0.31%. There are no pledged promoter holdings reported.

View full answer

Is Nahar Capital technically bullish or bearish?

15-Jul-2025

As of 14 July 2025, Nahar Capital's technical trend is mildly bullish, supported by daily moving averages and a bullish weekly MACD, despite mixed signals from the monthly MACD and bearish KST.

As of 14 July 2025, the technical trend for Nahar Capital has changed from bullish to mildly bullish. The weekly MACD is bullish, while the monthly MACD is bearish, indicating mixed signals across time frames. The Bollinger Bands are mildly bullish on both weekly and monthly charts, supporting a positive outlook. Daily moving averages remain bullish, which adds to the mildly bullish stance. However, the KST shows a bearish signal on the monthly chart, and both the Dow Theory and OBV indicate no trend in the weekly and monthly time frames. Overall, the current technical stance is mildly bullish, driven primarily by the daily moving averages and weekly MACD.

View full answer

Is Nahar Capital overvalued or undervalued?

09-Jun-2025

As of February 1, 2024, Nahar Capital is considered overvalued with a valuation grade of "very expensive," reflected in its PE Ratio of 10.25 and high EV to EBITDA of 31.19, despite outperforming the Sensex in the short term, while its long-term performance has declined by 22.27%.

As of 1 February 2024, Nahar Capital's valuation grade has moved from fair to very expensive, indicating a significant shift in its market perception. The company is currently deemed overvalued. Key ratios include a PE Ratio of 10.25, an EV to EBITDA of 31.19, and a PEG Ratio of 0.03, which suggest that while the earnings are relatively low, the market is pricing the stock at a high multiple compared to its earnings growth potential.<BR><BR>In comparison to its peers, Nahar Capital's PE Ratio is lower than Bajaj Finance's 35.01 but higher than Life Insurance's 12.54, which reflects a mixed positioning within the industry. Additionally, its EV to EBITDA ratio is considerably higher than Life Insurance's 9.89, further supporting the overvaluation thesis. Notably, while Nahar Capital has outperformed the Sensex in the short term, with a 1-month return of 30.74% compared to the Sensex's 3.84%, the long-term performance shows a decline of 22.27% over three years, emphasizing the potential risks associated with its current valuation.

View full answer

Has Nahar Capital declared dividend?

06-Jun-2025

Nahar Capital & Financial Services Ltd has declared a 30% dividend, amounting to ₹1.5 per share, with an ex-date of September 6, 2024. While recent total returns have varied, the company has shown significant growth over the past five years, with a total return of 352.63%.

Nahar Capital & Financial Services Ltd has declared a 30% dividend.<BR><BR>Dividend Details:<BR>- Percentage announced: 30%<BR>- Amount per share: 1.5<BR>- Ex-date: 06 Sep 24<BR><BR>Dividend Yield: 0.51%.<BR><BR>Total Returns by Period:<BR>In the last 6 months, the price return was -15.79%, the dividend return was 0%, resulting in a total return of -15.79%.<BR><BR>Over the past year, the price return was 11.36%, the dividend return was 0.53%, leading to a total return of 11.89%.<BR><BR>In the 2-year period, the price return was 11.29%, the dividend return was 0.49%, culminating in a total return of 11.78%.<BR><BR>For the 3-year period, the price return was -28.92%, the dividend return was 0.89%, resulting in a total return of -28.03%.<BR><BR>In the last 4 years, the price return was 133.22%, the dividend return was 3.54%, yielding a total return of 136.76%.<BR><BR>Finally, over the past 5 years, the price return was 342.83%, the dividend return was 9.80%, leading to a total return of 352.63%.<BR><BR>Overall, Nahar Capital has declared a dividend, and while the recent total returns show variability, the long-term performance over 5 years indicates significant growth, particularly in price returns.

View full answer
iScoreScore
Click here to find our call on this stock
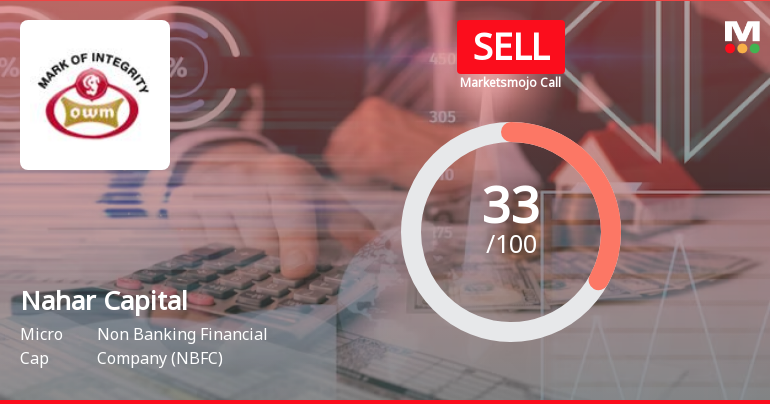
Strong Sell
Sell
Hold
Buy
Strong Buy

Dashboard

1

Weak Long Term Fundamental Strength with an average Return on Equity (ROE) of 5.88%

  • Poor long term growth as Net Sales has grown by an annual rate of 9.22% and Operating profit at 1.55%
2

With ROE of 3.9, it has a Very Expensive valuation with a 0.3 Price to Book Value

3

Consistent Underperformance against the benchmark over the last 3 years

stock-summaryMojo Parameters

Mojo Parameters

Loading Valuation Snapshot...

Stock DNA

stock-summary
Industry

Non Banking Financial Company (NBFC)

stock-summary
Market cap

INR 425 Cr (Micro Cap)

stock-summary
P/E

4.00

stock-summary
Industry P/E

21

stock-summary
Dividend Yield

0.58%

stock-summary
Debt Equity

0.01

stock-summary
Return on Equity

3.93%

stock-summary
Price to Book

0.27

Revenue and Profits:
Net Sales:
9 Cr
(Quarterly Results - Jun 2026)
Net Profit:
67 Cr
stock-summaryTotal Returns
Total Returns (Price + Dividend) stock-summary
Dividend Yield (0.58%)
TimePeriod
Price Return
Dividend Return
Total Return
3 Months
2.49%
0.59%
3.08%
6 Months
5.89%
0.63%
6.52%
1 Year
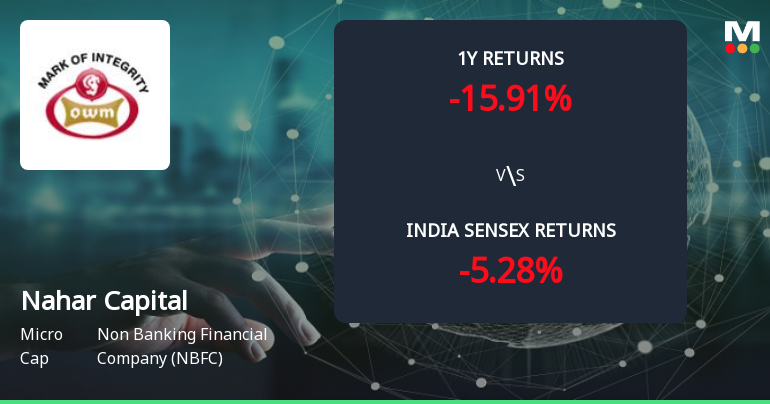
-15.91%
1.01%
-14.9%
2 Years
-17.92%
1.26%
-16.66%
3 Years
-8.65%
1.55%
-7.1%
4 Years
-34.57%
1.15%
-33.42%
5 Years
5.89%
3.25%
9.14%

Latest dividend: 1.5 per share ex-dividend date: Sep-04-2025

Risk Adjusted Returns v/s stock-summary
Returns Beta
Icon
Beta has not been calculated since enough price history is not available
stock-summaryNews & Corporate Actions

News

Nahar Capital Gains 9.08%: 2 Key Factors Driving the Weekly Rally

Announcements stock-summary

Nahar Capital and Financial Services Limited - Updates

05-Dec-2019 | Source : NSE

Nahar Capital and Financial Services Limited has informed the Exchange regarding 'DEMAT REPORT FOR THE MONTH OF NOVEMBER, 2019'.

Nahar Capital and Financial Services Limited - Clarification - Financial Results

03-Dec-2019 | Source : NSE

Nahar Capital and Financial Services Limitedl and Financial Services Limited for the quarter ended 30-Sep-2019 with respect to Regulation 33 of the SEBI (Listing Obligations and Disclosure Requirements) Regulations, 2015.

Nahar Capital and Financial Services Limited - Outcome of Board Meeting

13-Nov-2019 | Source : NSE

Nahar Capital and Financial Services Limited has informed the Exchange regarding Board meeting held on November 11, 2019.

Corporate Actions stock-summary

stock-summary
BOARD MEETING

No Upcoming Board Meetings

stock-summary
DIVIDEND

Nahar Capital & Financial Services Ltd has declared 30% dividend, ex-date: 04 Sep 26

stock-summary
SPLITS

No Splits history available

stock-summary
BONUS

No Bonus history available

stock-summary
RIGHTS

No Rights history available

stock-summaryKey Factors

Quality key factors stock-summary

Factor
Value
Sales Growth (5y)
9.22%
EBIT Growth (5y)
1.55%
Net Debt to Equity (avg)
0.01
Institutional Holding
0.67%
ROE (avg)
5.88%

Valuation key factors

Factor
Value
P/E Ratio
4
Industry P/E
0
Price to Book Value
0.27
EV to EBIT
26.11
EV to EBITDA
24.27
EV to Capital Employed
0.27
EV to Sales
13.83
PEG Ratio
0.03
Dividend Yield
0.59%
ROCE (Latest)
0.85%
ROE (Latest)
3.93%

Technicals key factors

Indicator
Weekly
Monthly
MACD
Bullish
Bearish
RSI
No Signal
No Signal
Bollinger Bands
Mildly Bullish
Mildly Bearish
Moving Averages
Bullish (Daily)
KST
Mildly Bearish
Bearish
Dow Theory
Mildly Bearish
Mildly Bullish
OBV
No Trend
No Trend
stock-summary Technical Indicator Scale: Bearish, Mildly Bearish, Sideways, Mildly Bullish, Bullish  Turned 
stock-summaryShareholding
Shareholding Snapshot : Jun 2026stock-summary
Shareholding Compare (%holding) stock-summary
Majority shareholders

Promoters

Pledged Promoter Holdings

None

Mutual Funds

Held by 3 Schemes (0.01%)

FIIs

Held by 7 FIIs (0.31%)

Promoter with highest holding

Nahar Poly Films Ltd (39.48%)

Highest Public shareholder

R A Max Private Limited (2.76%)

Individual Investors Holdings

19.84%

stock-summaryFinancial
[
  {
    "link": "quarterly",
    "btn_text": "All Quarterly Results",
    "header": "Quarterly Results Snapshot (Consolidated) - Jun'26 - QoQ",
    "rhs": [
      {
        "prefix": "Net Sales ",
        "suffix": "QoQ Growth in quarter ended Jun 2026 is 19.92% vs 65.89% in Mar 2026",
        "dir": -1
      },
      {
        "prefix": "Consolidated Net Profit ",
        "suffix": "QoQ Growth in quarter ended Jun 2026 is 270.75% vs 39.07% in Mar 2026",
        "dir": 1
      }
    ],
    "table": {
      "header": [
        "Jun'26",
        "Mar'26",
        "Change(%)"
      ],
      "body": [
        {
          "field": "Net Sales",
          "val1": "9.39",
          "val2": "7.83",
          "chgp": "19.92%",
          "chgp_class": "positive"
        },
        {
          "field": "Operating Profit (PBDIT) excl Other Income",
          "val1": "6.08",
          "val2": "3.52",
          "chgp": "72.73%",
          "chgp_class": "positive"
        },
        {
          "field": "Interest",
          "val1": "0.23",
          "val2": "0.15",
          "chgp": "53.33%",
          "chgp_class": "negative"
        },
        {
          "field": "Exceptional Items",
          "val1": "0.00",
          "val2": "0.00",
          "chgp": "",
          "chgp_class": "neutral"
        },
        {
          "field": "Consolidate Net Profit",
          "val1": "67.44",
          "val2": "18.19",
          "chgp": "270.75%",
          "chgp_class": "positive"
        },
        {
          "field": "Operating Profit Margin (Excl OI)",
          "val1": "64.75%",
          "val2": "44.96%",
          "chgp": "19.79%",
          "chgp_class": "positive"
        }
      ]
    }
  },
  {
    "link": "half-yearly",
    "btn_text": "All Half Yearly Results",
    "header": "Half Yearly Results Snapshot (Consolidated) - Sep'25",
    "rhs": [
      {
        "prefix": "Net Sales ",
        "suffix": " Growth in half year ended Sep 2025 is -16.23% vs 33.33% in Sep 2024",
        "dir": -1
      },
      {
        "prefix": "Consolidated Net Profit ",
        "suffix": " Growth in half year ended Sep 2025 is 44.14% vs 627.30% in Sep 2024",
        "dir": -1
      }
    ],
    "table": {
      "header": [
        "Sep'25",
        "Sep'24",
        "Change(%)"
      ],
      "body": [
        {
          "field": "Net Sales",
          "val1": "15.28",
          "val2": "18.24",
          "chgp": "-16.23%",
          "chgp_class": "negative"
        },
        {
          "field": "Operating Profit (PBDIT) excl Other Income",
          "val1": "9.32",
          "val2": "13.10",
          "chgp": "-28.85%",
          "chgp_class": "negative"
        },
        {
          "field": "Interest",
          "val1": "0.41",
          "val2": "0.20",
          "chgp": "105.00%",
          "chgp_class": "negative"
        },
        {
          "field": "Exceptional Items",
          "val1": "0.00",
          "val2": "0.00",
          "chgp": "",
          "chgp_class": "neutral"
        },
        {
          "field": "Consolidate Net Profit",
          "val1": "31.87",
          "val2": "22.11",
          "chgp": "44.14%",
          "chgp_class": "positive"
        },
        {
          "field": "Operating Profit Margin (Excl OI)",
          "val1": "60.99%",
          "val2": "71.82%",
          "chgp": "-10.83%",
          "chgp_class": "negative"
        }
      ]
    }
  },
  {
    "link": "nine-monthly",
    "btn_text": "All Nine Monthly Results",
    "header": "Nine Monthly Results Snapshot (Consolidated) - Dec'25",
    "rhs": [
      {
        "prefix": "Net Sales ",
        "suffix": "YoY Growth in nine months ended Dec 2025 is -12.43% vs 29.70% in Dec 2024",
        "dir": -1
      },
      {
        "prefix": "Consolidated Net Profit ",
        "suffix": "YoY Growth in nine months ended Dec 2025 is 57.17% vs 889.62% in Dec 2024",
        "dir": -1
      }
    ],
    "table": {
      "header": [
        "Dec'25",
        "Dec'24",
        "Change(%)"
      ],
      "body": [
        {
          "field": "Net Sales",
          "val1": "20.00",
          "val2": "22.84",
          "chgp": "-12.43%",
          "chgp_class": "negative"
        },
        {
          "field": "Operating Profit (PBDIT) excl Other Income",
          "val1": "11.33",
          "val2": "15.32",
          "chgp": "-26.04%",
          "chgp_class": "negative"
        },
        {
          "field": "Interest",
          "val1": "0.51",
          "val2": "0.26",
          "chgp": "96.15%",
          "chgp_class": "negative"
        },
        {
          "field": "Exceptional Items",
          "val1": "0.00",
          "val2": "0.00",
          "chgp": "",
          "chgp_class": "neutral"
        },
        {
          "field": "Consolidate Net Profit",
          "val1": "44.95",
          "val2": "28.60",
          "chgp": "57.17%",
          "chgp_class": "positive"
        },
        {
          "field": "Operating Profit Margin (Excl OI)",
          "val1": "56.65%",
          "val2": "67.08%",
          "chgp": "-10.43%",
          "chgp_class": "negative"
        }
      ]
    }
  },
  {
    "link": "annual",
    "btn_text": "All Annual Results",
    "header": "Annual Results Snapshot (Consolidated) - Mar'26",
    "rhs": [
      {
        "prefix": "Net Sales ",
        "suffix": "YoY Growth in year ended Mar 2026 is 6.30% vs 9.63% in Mar 2025",
        "dir": -1
      },
      {
        "prefix": "Consolidated Net Profit ",
        "suffix": "YoY Growth in year ended Mar 2026 is 26.76% vs 323.19% in Mar 2025",
        "dir": -1
      }
    ],
    "table": {
      "header": [
        "Mar'26",
        "Mar'25",
        "Change(%)"
      ],
      "body": [
        {
          "field": "Net Sales",
          "val1": "27.83",
          "val2": "26.18",
          "chgp": "6.30%",
          "chgp_class": "positive"
        },
        {
          "field": "Operating Profit (PBDIT) excl Other Income",
          "val1": "14.84",
          "val2": "16.55",
          "chgp": "-10.33%",
          "chgp_class": "negative"
        },
        {
          "field": "Interest",
          "val1": "0.66",
          "val2": "0.46",
          "chgp": "43.48%",
          "chgp_class": "negative"
        },
        {
          "field": "Exceptional Items",
          "val1": "0.00",
          "val2": "0.00",
          "chgp": "",
          "chgp_class": "neutral"
        },
        {
          "field": "Consolidate Net Profit",
          "val1": "63.14",
          "val2": "49.81",
          "chgp": "26.76%",
          "chgp_class": "positive"
        },
        {
          "field": "Operating Profit Margin (Excl OI)",
          "val1": "53.32%",
          "val2": "63.22%",
          "chgp": "-9.90%",
          "chgp_class": "negative"
        }
      ]
    }
  }
]

Quarterly Results Snapshot (Consolidated) - Jun'26 - QoQstock-summary

Jun'26
Mar'26
Change(%)
Net Sales
9.39
7.83
19.92%
Operating Profit (PBDIT) excl Other Income
6.08
3.52
72.73%
Interest
0.23
0.15
53.33%
Exceptional Items
0.00
0.00
Consolidate Net Profit
67.44
18.19
270.75%
Operating Profit Margin (Excl OI)
64.75%
44.96%
19.79%
Values in Rs Cr.
Direction Arrows
Net Sales

QoQ Growth in quarter ended Jun 2026 is 19.92% vs 65.89% in Mar 2026

Direction Arrows
Consolidated Net Profit

QoQ Growth in quarter ended Jun 2026 is 270.75% vs 39.07% in Mar 2026

Half Yearly Results Snapshot (Consolidated) - Sep'25stock-summary

Sep'25
Sep'24
Change(%)
Net Sales
15.28
18.24
-16.23%
Operating Profit (PBDIT) excl Other Income
9.32
13.10
-28.85%
Interest
0.41
0.20
105.00%
Exceptional Items
0.00
0.00
Consolidate Net Profit
31.87
22.11
44.14%
Operating Profit Margin (Excl OI)
60.99%
71.82%
-10.83%
Values in Rs Cr.
Direction Arrows
Net Sales

Growth in half year ended Sep 2025 is -16.23% vs 33.33% in Sep 2024

Direction Arrows
Consolidated Net Profit

Growth in half year ended Sep 2025 is 44.14% vs 627.30% in Sep 2024

Nine Monthly Results Snapshot (Consolidated) - Dec'25stock-summary

Dec'25
Dec'24
Change(%)
Net Sales
20.00
22.84
-12.43%
Operating Profit (PBDIT) excl Other Income
11.33
15.32
-26.04%
Interest
0.51
0.26
96.15%
Exceptional Items
0.00
0.00
Consolidate Net Profit
44.95
28.60
57.17%
Operating Profit Margin (Excl OI)
56.65%
67.08%
-10.43%
Values in Rs Cr.
Direction Arrows
Net Sales

YoY Growth in nine months ended Dec 2025 is -12.43% vs 29.70% in Dec 2024

Direction Arrows
Consolidated Net Profit

YoY Growth in nine months ended Dec 2025 is 57.17% vs 889.62% in Dec 2024

Annual Results Snapshot (Consolidated) - Mar'26stock-summary

Mar'26
Mar'25
Change(%)
Net Sales
27.83
26.18
6.30%
Operating Profit (PBDIT) excl Other Income
14.84
16.55
-10.33%
Interest
0.66
0.46
43.48%
Exceptional Items
0.00
0.00
Consolidate Net Profit
63.14
49.81
26.76%
Operating Profit Margin (Excl OI)
53.32%
63.22%
-9.90%
Values in Rs Cr.
Direction Arrows
Net Sales

YoY Growth in year ended Mar 2026 is 6.30% vs 9.63% in Mar 2025

Direction Arrows
Consolidated Net Profit

YoY Growth in year ended Mar 2026 is 26.76% vs 323.19% in Mar 2025

stock-summaryCompany CV
About Nahar Capital & Financial Services Ltd stock-summary
stock-summary
Nahar Capital & Financial Services Ltd
Micro Cap
Non Banking Financial Company (NBFC)
Nahar Capital and Financial Services Limited is a Non Banking Finance Company. The Company's primary business activities are 'Investment/Financial Activities' comprising of Long Term Investments, Strategic Investments and Short Term / Trading Investments. Besides, the Company's business activities also include lending activities which is primarily to Group Companies and Affiliates.
Company Coordinates stock-summary
Company Details
375 Industrial Area A , Ludhiana Punjab : 141003
stock-summary
Tel: 91-161-2665000
stock-summary
sencfs@owmnahar.com
Registrar Details
Alankit Assignments Ltd , Alankit House , 2 E/21, Jhandewala Extension, New Delhi