
 Price Point
Compare Nahar Indl. Ent. with Similar Stocks
ScoreDashboard
Weak Long Term Fundamental Strength with a -26.86% CAGR growth in Operating Profits over the last 5 years
- Low ability to service debt as the company has a high Debt to EBITDA ratio of 11.25 times
- The company has been able to generate a Return on Equity (avg) of 6.81% signifying low profitability per unit of shareholders funds
Positive results in Jun 26
With ROCE of 0.6, it has a Attractive valuation with a 0.7 Enterprise value to Capital Employed
Despite the size of the company, domestic mutual funds hold only 0.06% of the company
Mojo ParametersStock DNA

Garments & Apparels

INR 560 Cr (Micro Cap)

8.00
52

0.00%

0.61

4.99%

0.55
Total ReturnsTotal Returns (Price + Dividend) 
Latest dividend: 1 per share ex-dividend date: Sep-07-2017
Risk Adjusted Returns v/s
Returns Beta
 News & Corporate Actions
News

Nahar Industrial Enterprises Ltd: Technical Momentum Shifts Signal Mildly Bullish Outlook
Nahar Industrial Enterprises Ltd, a micro-cap player in the Garments & Apparels sector, has recently experienced a nuanced shift in its technical momentum. While some indicators signal bullish tendencies, others suggest caution, reflecting a complex market sentiment as the stock navigates a mildly bullish phase following a recent upgrade from a Sell to Hold rating.
Read full news article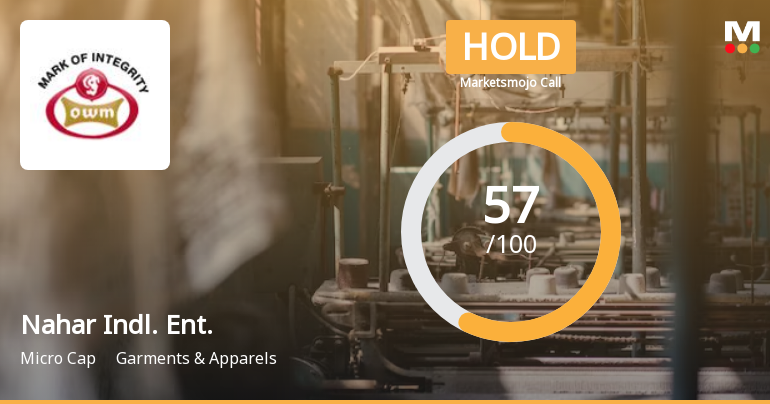
Nahar Industrial Enterprises Ltd is Rated Hold
Nahar Industrial Enterprises Ltd is rated 'Hold' by MarketsMOJO, with this rating last updated on 10 September 2026. However, the analysis and financial metrics discussed here reflect the stock's current position as of 22 September 2026, providing investors with the latest insights into the company's performance and outlook.
Read full news article
Nahar Industrial Enterprises Ltd Technical Momentum Shifts to Bullish Amid Market Outperformance
Nahar Industrial Enterprises Ltd, a micro-cap player in the Garments & Apparels sector, has witnessed a notable shift in its technical momentum, upgrading from a mildly bullish to a bullish trend. This change is underscored by a combination of positive moving averages and MACD signals, although some indicators like the weekly RSI suggest caution. The stock’s recent performance outpaces the broader Sensex, reflecting growing investor interest despite mixed signals from certain technical parameters.
Read full news article Announcements
Announcement under Regulation 30 (LODR)-Credit Rating
11-Sep-2026 | Source : BSECREDIT RATING
Notice Of 42Nd Annual General Meeting Book Closure And E-Voting
10-Sep-2026 | Source : BSEIntimation of 42nd Annual General Meeting Book Closure and E-voting
Announcement under Regulation 30 (LODR)-Newspaper Publication
10-Sep-2026 | Source : BSENEWSPAPER PUBICATION OF NOTICE OF 42ND ANNUAL GENERAL MEETING
Corporate Actions

No Upcoming Board Meetings

Nahar Industrial Enterprises Ltd has declared 10% dividend, ex-date: 07 Sep 17

No Splits history available

No Bonus history available

No Rights history available
Key FactorsQuality key factors
Valuation key factors
Technicals key factors
 Technical Indicator Scale: Bearish, Mildly Bearish, Sideways, Mildly Bullish, Bullish Turned Shareholding
Shareholding Snapshot : Jun 2026
Shareholding Compare (%holding)
Promoters
None
Held by 10 Schemes (0.02%)
Held by 2 FIIs (0.01%)
J L Growth Fund Limited (17.3%)
Investor Education And Protection Authority (7.09%)
18.91%
FinancialQuarterly Results Snapshot (Consolidated) - Jun'26 - QoQ
 Compare with Peers
QoQ Growth in quarter ended Jun 2026 is -6.76% vs -0.21% in Mar 2026
QoQ Growth in quarter ended Jun 2026 is 0.04% vs 331.26% in Mar 2026

Half Yearly Results Snapshot (Consolidated) - Sep'25

Growth in half year ended Sep 2025 is 2.60% vs -3.40% in Sep 2024
Growth in half year ended Sep 2025 is 940.00% vs 82.97% in Sep 2024
Nine Monthly Results Snapshot (Consolidated) - Dec'25
YoY Growth in nine months ended Dec 2025 is -6.23% vs 3.72% in Dec 2024
YoY Growth in nine months ended Dec 2025 is 1,109.63% vs 123.24% in Dec 2024
Annual Results Snapshot (Consolidated) - Mar'26
YoY Growth in year ended Mar 2026 is -7.95% vs 3.96% in Mar 2025
YoY Growth in year ended Mar 2026 is 177.66% vs 90.03% in Mar 2025
 Company CV
About Nahar Industrial Enterprises Ltd










