
Compare Nahar Poly with Similar Stocks
Dashboard
Company's ability to service its debt is strong with a healthy EBIT to Interest (avg) ratio of 11.05
Poor long term growth as Operating profit has grown by an annual rate 3.22% of over the last 5 years
The company has declared Positive results for the last 8 consecutive quarters
With ROE of 9.1, it has a Very Attractive valuation with a 0.7 Price to Book Value
Despite the size of the company, domestic mutual funds hold only 0.03% of the company
Below par performance in long term as well as near term
Total Returns (Price + Dividend) 
Latest dividend: 1 per share ex-dividend date: Sep-04-2025
Risk Adjusted Returns v/s
Returns Beta

News

Nahar Polyfilms Ltd Upgraded to Hold on Improved Valuation and Financial Metrics
Nahar Polyfilms Ltd, a micro-cap player in the packaging sector, has seen its investment rating upgraded from Sell to Hold as of 1 July 2026. This change reflects significant improvements in valuation metrics, financial trends, and technical assessments, despite some lingering concerns over long-term growth and market performance. The company’s current Mojo Score stands at 51.0, signalling a cautious but optimistic outlook for investors.
Read full news article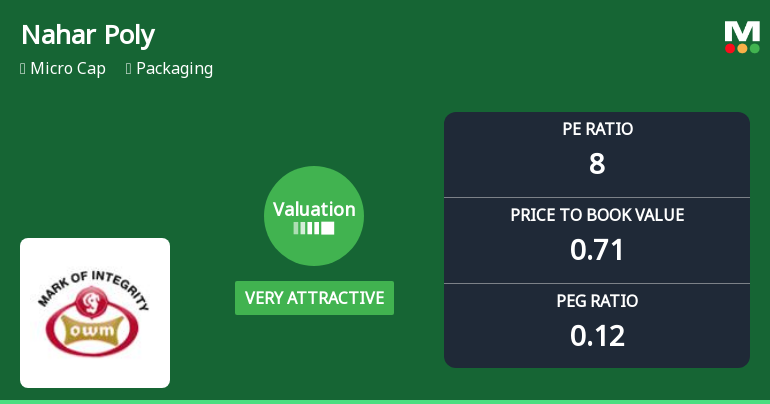
Nahar Polyfilms Ltd Valuation Shifts to Very Attractive Amid Mixed Market Returns
Nahar Polyfilms Ltd has witnessed a significant improvement in its valuation parameters, shifting from an attractive to a very attractive rating. This change reflects a notable reappraisal of the stock’s price-to-earnings (P/E) and price-to-book value (P/BV) ratios relative to its historical averages and peer group, positioning it as a compelling micro-cap opportunity within the packaging sector.
Read full news article
Nahar Polyfilms Ltd is Rated Sell
Nahar Polyfilms Ltd is rated Sell by MarketsMOJO, with this rating last updated on 01 June 2026. However, the analysis and financial metrics discussed here reflect the stock's current position as of 24 June 2026, providing investors with the most up-to-date view of the company’s fundamentals, returns, and market performance.
Read full news article Announcements
Nahar Poly Films Limited - Updates
05-Dec-2019 | Source : NSENahar Poly Films Limited has informed the Exchange regarding 'Pursuant to the provisions of Regulation 74(5) of Securities and Exchange Board of India (Depositories and Participants) Regulations, 2018, the Company is required to inform every Stock Exchange where its securities are listed regarding the Dematerialization of Securities of the Company. In compliance thereof, we are hereby submitting the demat report with necessary certificate giving particulars of shares i.e. Distinctive No(s), Certificate No(s), No. of shares etc. dematerialized during the month of November, 2019'.
Nahar Poly Films Limited - Outcome of Board Meeting
13-Nov-2019 | Source : NSENahar Poly Films Limited has informed the Exchange regarding Board meeting held on November 11, 2019.
Nahar Poly Films Limited - Credit Rating
25-Oct-2019 | Source : NSENahar Poly Films Limited has informed the Exchange regarding Credit Rating re-affirmed by M/s CARE Ratings with the rating action Placed on Credit Watch with Developing Implications for the Long term bank facilities of Rs. 232 Crores at "CARE A-" (Single A Minus) which indicates stable and for the Short term bank facilities of Rs. 21 Crores at CARE A2+ (A Two Plus) which indicates strong degree of safety regarding timely payment of the financial obligations .
Corporate Actions

No Upcoming Board Meetings

Nahar Polyfilms Ltd has declared 20% dividend, ex-date: 04 Sep 25

No Splits history available

No Bonus history available

No Rights history available
Quality key factors
Valuation key factors
Technicals key factors
 Technical Indicator Scale: Bearish, Mildly Bearish, Sideways, Mildly Bullish, Bullish Turned
 Shareholding Snapshot : Mar 2026
Shareholding Compare (%holding)
Promoters
None
Held by 2 Schemes (0.01%)
Held by 3 FIIs (0.03%)
Nahar Capital And Financial Services Ltd (49.16%)
Sangeetha S (2.4%)
21.39%
Quarterly Results Snapshot (Consolidated) - Mar'26 - QoQ

QoQ Growth in quarter ended Mar 2026 is 0.13% vs -2.80% in Dec 2025
QoQ Growth in quarter ended Mar 2026 is 6.05% vs -6.98% in Dec 2025
Half Yearly Results Snapshot (Consolidated) - Sep'25

Growth in half year ended Sep 2025 is 9.72% vs 14.71% in Sep 2024
Growth in half year ended Sep 2025 is 51.67% vs 158.23% in Sep 2024
Nine Monthly Results Snapshot (Consolidated) - Dec'25
YoY Growth in nine months ended Dec 2025 is 5.34% vs 13.98% in Dec 2024
YoY Growth in nine months ended Dec 2025 is 75.56% vs 598.11% in Dec 2024
Annual Results Snapshot (Consolidated) - Mar'26
YoY Growth in year ended Mar 2026 is 5.75% vs 11.00% in Mar 2025
YoY Growth in year ended Mar 2026 is 66.40% vs 734.15% in Mar 2025
About Nahar Polyfilms Ltd

Company Coordinates


