Nahar Spinning

  • Market Cap: Micro Cap
  • Industry: Garments & Apparels
  • ISIN: INE290A01027
  • NSEID: NAHARSPING
  • BSEID: 500296
INR
277.45
0.15 (0.05%)
BSENSE

Sep 10, 10:23 AM

BSE+NSE Vol: 25.2 k

  • Price Points
  • Score
  • Mojo Parameters
  • Total Return
  • News and Corporate Actions
  • Key factors
  • Shareholding
  • Financials
  • CompanyCV
stock-summaryPrice Point
High/Low

1Day

52 Week

Valuation
Technical
Day's Volume

CASH

25.2 k (107.23%) Volume

Shareholding (Jun 2026)

FII

0.00%

Held by 1 FIIs

DII

0.02%

Held by 0 DIIs

Promoter

68.03%

Why is Nahar Spinning Mills Ltd falling/rising?

06-Sep-2026

As of 05-Sep, Nahar Spinning Mills Ltd's stock price is declining, currently at 289.95, with a 1.24% decrease and underperformance compared to its sector. Investor participation is waning, indicated by a 45.53% drop in delivery volume, while the stock shows short-term weakness despite trading above longer-term moving averages.

As of 05-Sep, Nahar Spinning Mills Ltd's stock price is falling, currently at 289.95, which reflects a decrease of 3.65 or 1.24%. The stock has been underperforming, having lost 3.53% over the last three days and showing a performance today that underperformed its sector by 1.79%. Additionally, the stock reached an intraday low of Rs 286.8, indicating a decline of 2.32% during the trading session.<BR><BR>Investor participation appears to be declining, as evidenced by a significant drop in delivery volume, which fell by 45.53% compared to the 5-day average. Although the stock is trading above its 50-day, 100-day, and 200-day moving averages, it is below its 5-day and 20-day moving averages, suggesting a short-term weakness in price momentum. Overall, these factors contribute to the current downward trend in Nahar Spinning Mills Ltd's stock price.

View full answer

Who are in the management team of Nahar Spinning?

01-Sep-2026

The management team of Nahar Spinning includes Chairman Jawahar Lal Oswal, Managing Director Dinesh Oswal, and several Non-Executive and Independent Directors, such as Kamal Oswal, Dinesh Gogna, and Manisha Gupta, among others. They are responsible for the company's strategic direction and governance.

The management team of Nahar Spinning includes the following individuals:<BR><BR>1. **Jawahar Lal Oswal** - Chairman & Non-Executive Director<BR>2. **Dinesh Oswal** - Executive Director / Managing Director / Promoter<BR>3. **Kamal Oswal** - Non-Executive Director<BR>4. **Dinesh Gogna** - Non-Executive Director<BR>5. **S K Sharma** - Non-Executive Director<BR>6. **Manisha Gupta** - Independent Non-Executive Director<BR>7. **Vijay Asdhir** - Independent Non-Executive Director<BR>8. **Roshan Lal Behl** - Independent Non-Executive Director<BR>9. **Yash Paul Sachdeva** - Independent Non-Executive Director<BR>10. **Anchal Kumar Jain** - Independent Non-Executive Director<BR><BR>This team plays a crucial role in guiding the company's strategic direction and governance.

View full answer

What does Nahar Spinning do?

01-Sep-2026

Nahar Spinning Mills Ltd manufactures cotton, blended, and synthetic yarn, as well as hosiery knitwear, and is classified as a Micro Cap company with a market cap of INR 1,064 Cr. As of June 2026, it reported net sales of 966 Cr and a net profit of 70 Cr.

Overview: <BR>Nahar Spinning Mills Ltd is engaged in the manufacture of cotton yarn, blended and synthetic yarn, and hosiery knitwears, operating within the Garments & Apparels industry and classified as a Micro Cap company.<BR><BR>History: <BR>Nahar Spinning Mills Limited was incorporated as a Private Limited Company in December 1980 and became a Public Limited Company in 1983. The latest quarterly results reported net sales and net profit for June 2026.<BR><BR>Financial Snapshot: <BR>Most recent Net Sales: 966 Cr (Quarterly Results - Jun 2026) <BR>Most recent Net Profit: 70 Cr (Quarterly Results - Jun 2026) <BR>Market-cap value: INR 1,064 Cr (Micro Cap)<BR><BR>Key Metrics: <BR>P/E: 14.00 <BR>Industry P/E: 28 <BR>Dividend Yield: 0.35% <BR>Debt-Equity: 0.65 <BR>Return on Equity: 5.05% <BR>Price to Book: 0.69<BR><BR>Contact Details: <BR>Address: 373 Industrial Area A, Nahar Tower Ludhiana Punjab : 141003 <BR>Tel: 91-0161-2600701 to 2600705 <BR>Email: secnsm@owmnahar.com <BR>Website: http://www.owmnahar.com

View full answer

Who are the peers of the Nahar Spinning?

01-Sep-2026

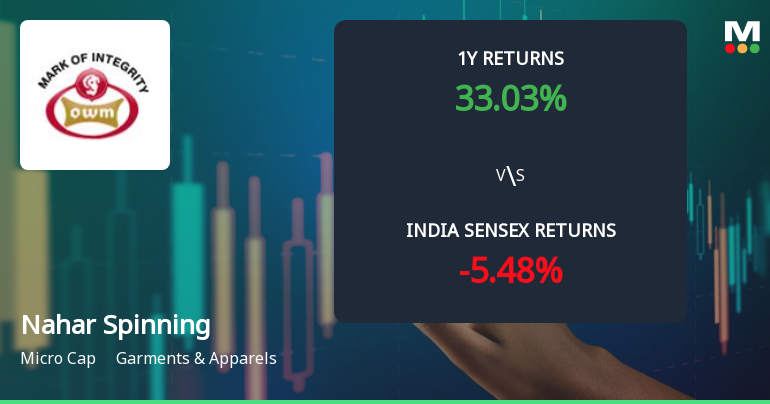
Nahar Spinning's peers include Century Enka, Rupa & Co, and Ambika Cotton, among others. While Ambika Cotton shows excellent management and growth, Nahar Spinning has below-average growth and capital structure, with a 1-year return of 35.34%.

Peers: The peers of Nahar Spinning are Century Enka, Rupa & Co, Sunrakshakk Inds, Monte Carlo Fas., Swaraj Suiting, Ambika Cotton, RSWM Ltd, Himatsing. Seide, Sumeet Industrie.<BR><BR>Quality Snapshot: Excellent management risk is observed at Ambika Cotton, while Average management risk is found at Century Enka, Rupa & Co, Sunrakshakk Inds, Monte Carlo Fas., Swaraj Suiting, Himatsing. Seide, and the rest. Good growth is noted at Ambika Cotton and Sunrakshakk Inds, while Below Average growth is seen at Rupa & Co, Monte Carlo Fas., Nahar Spinning, Swaraj Suiting, RSWM Ltd, Himatsing. Seide, Sumeet Industrie, and the rest. Excellent capital structure is present at Century Enka, Rupa & Co, and Ambika Cotton, while Below Average capital structure is noted at Nahar Spinning, Monte Carlo Fas., Swaraj Suiting, RSWM Ltd, Himatsing. Seide, Sumeet Industrie, and the rest.<BR><BR>Return Snapshot: Sunrakshakk Inds has the highest 1-year return at 60.83%, while Himatsing. Seide has the lowest at -39.94%. Nahar Spinning's 1-year return of 35.34% is significantly higher than Himatsing. Seide's. Additionally, Sumeet Industrie and Himatsing. Seide have negative six-month returns.

View full answer

How big is Nahar Spinning?

01-Sep-2026

As of 31st August, Nahar Spinning Mills Ltd has a market capitalization of 1,064.00 Cr, with recent net sales of 3,364.75 Cr and a net profit of 75.74 Cr. The company reported shareholder's funds of 1,489.36 Cr and total assets of 2,749.77 Cr for the annual period ending in March 2025.

As of 31st August, Nahar Spinning Mills Ltd has a market capitalization of 1,064.00 Cr, categorizing it as a Micro Cap company.<BR><BR>In the latest four quarters, Nahar Spinning reported Net Sales of 3,364.75 Cr and a Net Profit of 75.74 Cr.<BR><BR>For the latest annual period ending in March 2025, the company had Shareholder's Funds amounting to 1,489.36 Cr and Total Assets of 2,749.77 Cr.

View full answer

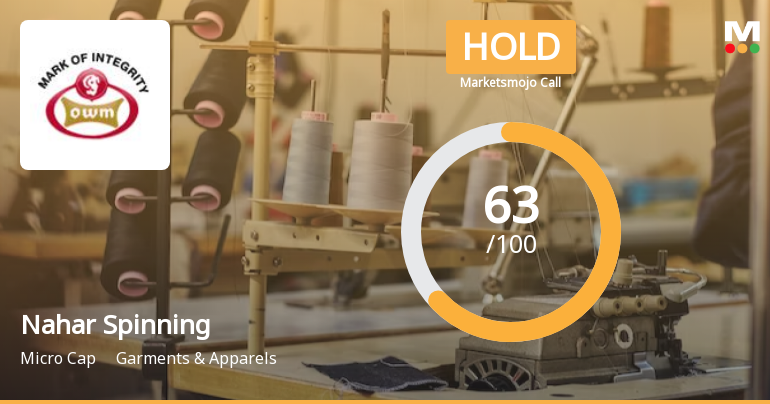
Should I buy, sell or hold Nahar Spinning Mills Ltd?

06-Aug-2026

When is the next results date for Nahar Spinning Mills Ltd?

28-Jul-2026

The next results date for Nahar Spinning Mills Ltd is August 5, 2026.

The next results date for Nahar Spinning Mills Ltd is scheduled for August 5, 2026.

View full answer

Are Nahar Spinning Mills Ltd latest results good or bad?

29-May-2026

Nahar Spinning Mills Ltd's latest results show a strong recovery in Q4 FY26 with a net profit of ₹23.42 crores, but ongoing margin pressures and a negative stock performance raise concerns about the sustainability of this turnaround, suggesting caution for investors.

Nahar Spinning Mills Ltd's latest results present a mixed picture. On one hand, the company reported a significant recovery in Q4 FY26, achieving a net profit of ₹23.42 crores, which is a remarkable 281.23% increase quarter-on-quarter and a 4.51% increase year-on-year. Additionally, revenue for the quarter reached ₹916.82 crores, marking a 30.50% increase from the previous quarter and a 4.71% increase year-on-year.<BR><BR>However, despite this strong quarterly performance, the company continues to face persistent margin pressures. The operating margin improved to 6.43%, up from 2.11% in the previous quarter, but it remains below the levels seen in previous years. The company's profitability has been volatile, having experienced losses in the two preceding quarters, raising concerns about the sustainability of this recovery.<BR><BR>Moreover, Nahar Spinning's stock has underperformed over the past year, delivering a negative return of 11.31%, which is worse than both the Sensex and its sector peers. The company's return on equity has significantly declined to just 1.46%, indicating issues with capital efficiency.<BR><BR>In summary, while the latest quarterly results show a positive turnaround, the ongoing challenges with margins, volatility in earnings, and underperformance in the stock market suggest that investors should approach with caution.

View full answer

Is Nahar Spinning technically bullish or bearish?

04-Dec-2025

As of December 3, 2025, Nahar Spinning exhibits a bearish trend with moderate strength, supported by bearish indicators across weekly and monthly MACD, Bollinger Bands, and moving averages, along with significant underperformance compared to the Sensex.

As of 3 December 2025, the technical trend for Nahar Spinning has changed from mildly bearish to bearish. The current stance is bearish with a moderate strength. The weekly MACD is mildly bullish, but the monthly MACD and KST are bearish, indicating weakness in the longer-term trend. Both the weekly and monthly Bollinger Bands are bearish, supporting the downward momentum. Daily moving averages also confirm a bearish outlook. The stock has underperformed significantly compared to the Sensex over various time frames, particularly year-to-date and over the past year. Overall, the combination of indicators suggests a bearish sentiment prevailing in the market for Nahar Spinning.

View full answer

How has been the historical performance of Nahar Spinning?

01-Dec-2025

Nahar Spinning's historical performance shows fluctuating financial metrics, with net sales increasing to 3,284.56 Cr by Mar'25, but operating profit significantly dropped to 195.80 Cr. However, the company has shown signs of recovery, with profit before tax turning positive at 21.13 Cr and improved cash flow from operations at 93.00 Cr in Mar'25.

Answer:<BR>The historical performance of Nahar Spinning shows a fluctuating trend in key financial metrics over the years.<BR><BR>Breakdown:<BR>Nahar Spinning's net sales increased from 2,796.91 Cr in Mar'23 to 3,284.56 Cr in Mar'25, demonstrating a positive growth trajectory. However, total operating income peaked at 3,593.86 Cr in Mar'22 before declining to 3,284.56 Cr in Mar'25. The raw material cost has also risen, reaching 2,222.28 Cr in Mar'25 from 1,825.12 Cr in Mar'23, indicating increased operational expenses. Operating profit (PBDIT) saw a significant drop from 818.41 Cr in Mar'22 to 195.80 Cr in Mar'25, reflecting challenges in maintaining profitability. Profit before tax turned positive at 21.13 Cr in Mar'25 after a loss of 61.38 Cr in Mar'24, while profit after tax also recovered to 12.35 Cr from a loss of 51.08 Cr in the previous year. The company's total liabilities decreased from 2,889.09 Cr in Mar'24 to 2,749.77 Cr in Mar'25, and total assets followed a similar trend, declining to 2,749.77 Cr from 2,889.09 Cr. Cash flow from operating activities improved to 93.00 Cr in Mar'25, contrasting with a negative cash flow of -394.00 Cr in Mar'24, indicating a recovery in operational efficiency. Overall, while Nahar Spinning has faced fluctuations in profitability and operational costs, recent trends suggest a potential recovery in financial performance.

View full answer

Is Nahar Spinning overvalued or undervalued?

18-Nov-2025

As of November 17, 2025, Nahar Spinning is considered very attractive due to its undervaluation, highlighted by a PE ratio of 20.09, a PEG ratio of 0.08, and a strong long-term return of 397.31%, despite recent underperformance against the Sensex.

As of 17 November 2025, the valuation grade for Nahar Spinning has moved from attractive to very attractive. This indicates a strong positive shift in its valuation outlook. The company is currently assessed as undervalued, supported by a PE ratio of 20.09, a Price to Book Value of 0.48, and an EV to EBITDA of 7.93. <BR><BR>In comparison to its peers, Nahar Spinning stands out with a significantly lower PEG ratio of 0.08, while K P R Mill Ltd is considered very expensive with a PE ratio of 44.24, and Trident is attractive with a PE ratio of 32.69. Additionally, Nahar Spinning's EV to Sales ratio of 0.45 further emphasizes its undervaluation relative to the industry. Despite recent underperformance against the Sensex, particularly over the last year, the long-term outlook remains promising, as evidenced by a substantial 5-year return of 397.31%.

View full answer

Who are the top shareholders of the Nahar Spinning?

17-Jul-2025

The top shareholders of Nahar Spinning are primarily promoters, with Nahar Capital And Financial Services Ltd. holding 46.47%. Individual investors own 26.99%, led by Anil Kumar Goel at 5.14%, while mutual funds and foreign institutional investors hold minor stakes.

The top shareholders of Nahar Spinning include the promoters, who hold the majority of the shares. The promoter with the highest holding is Nahar Capital And Financial Services Ltd., which owns 46.47% of the company. Additionally, individual investors collectively hold 26.99% of the shares, with the highest public shareholder being Anil Kumar Goel, who has a stake of 5.14%. Mutual funds and foreign institutional investors (FIIs) have minor holdings, with mutual funds holding 0.58% across four schemes and FIIs holding 0.08% across four entities. There are no pledged promoter holdings reported.

View full answer

Has Nahar Spinning declared dividend?

06-Jun-2025

Yes, Nahar Spinning Mills Ltd has declared a 20% dividend, amounting to ₹1 per share, with an ex-date of September 6, 2024. The dividend yield is 0.36%, and total returns have varied significantly across different periods, with a notable 662.26% total return over the past 5 years.

Nahar Spinning Mills Ltd has declared a dividend.<BR><BR>Dividend Details:<BR>- Percentage announced: 20%<BR>- Amount per share: 1 per share<BR>- Ex-date: 06 Sep 24<BR><BR>Dividend Yield: 0.36%.<BR><BR>Total Returns by Period:<BR>In the 6-month period, the price return was 4.74%, with a dividend return of 0%, resulting in a total return of 4.74%.<BR><BR>For the 1-year period, the price return was 12.73%, with a dividend return of 0.38%, leading to a total return of 13.11%.<BR><BR>Over the 2-year period, the price return was 2.09%, with a dividend return of 0.35%, resulting in a total return of 2.44%.<BR><BR>In the 3-year period, the price return was -30.64%, with a dividend return of 1.06%, leading to a total return of -29.58%.<BR><BR>For the 4-year period, the price return was 85.1%, with a dividend return of 2.64%, resulting in a total return of 87.74%.<BR><BR>In the 5-year period, the price return was 645.55%, with a dividend return of 16.71%, leading to a total return of 662.26%.<BR><BR>Overall, Nahar Spinning Mills Ltd has declared a dividend, and while the dividend yield is relatively low, the total returns over various periods show significant variability, with particularly strong performance over the 5-year period.

View full answer
iScoreScore
Click here to find our call on this stock
Strong Sell
Sell
Hold
Buy
Strong Buy

Dashboard

1

Weak Long Term Fundamental Strength with a -13.95% CAGR growth in Operating Profits over the last 5 years

  • Low ability to service debt as the company has a high Debt to EBITDA ratio of 6.24 times
  • The company has been able to generate a Return on Equity (avg) of 8.26% signifying low profitability per unit of shareholders funds
2

With a growth in Net Profit of 337.84%, the company declared Very Positive results in Jun 26

3

With ROCE of 2.7, it has a Attractive valuation with a 0.8 Enterprise value to Capital Employed

4

Despite the size of the company, domestic mutual funds hold only 0.03% of the company

stock-summaryMojo Parameters

Mojo Parameters

Loading Valuation Snapshot...

Stock DNA

stock-summary
Industry

Garments & Apparels

stock-summary
Market cap

INR 1,001 Cr (Micro Cap)

stock-summary
P/E

13.00

stock-summary
Industry P/E

28

stock-summary
Dividend Yield

0.36%

stock-summary
Debt Equity

0.65

stock-summary
Return on Equity

5.05%

stock-summary
Price to Book

0.66

Revenue and Profits:
Net Sales:
966 Cr
(Quarterly Results - Jun 2026)
Net Profit:
70 Cr
stock-summaryTotal Returns
Total Returns (Price + Dividend) stock-summary
Dividend Yield (0.36%)
TimePeriod
Price Return
Dividend Return
Total Return
3 Months
4.88%
0.38%
5.26%
6 Months
39.28%
0.54%
39.82%
1 Year
27.41%
0.47%
27.88%
2 Years
-9.02%
0.67%
-8.35%
3 Years
-4.08%
1.13%
-2.95%
4 Years
-18.08%
0.98%
-17.1%
5 Years
-33.19%
1.49%
-31.7%

Latest dividend: 1.0022468026270306 per share ex-dividend date: Sep-04-2026

Risk Adjusted Returns v/s stock-summary
Returns Beta
Icon
Beta has not been calculated since enough price history is not available
stock-summaryNews & Corporate Actions

Announcements stock-summary

Nahar Spinning Mills Limited - Outcome of Board Meeting

13-Nov-2019 | Source : NSE

Nahar Spinning Mills Limited has informed the Exchange regarding Board meeting held on November 11, 2019.

Disclosure under SEBI Takeover Regulations

11-Sep-2019 | Source : NSE

Nahar Capital and Financial Services Ltd has submitted to the Exchange, vide letter dated September 11 , 2019 a copy of disclosure under Regulation 10(6) in respect of acquisition under Regulation 10 of SEBI (Substantial Acquisition of Shares & Takeovers) Regulations, 2011.

Updates

10-Sep-2019 | Source : NSE

Nahar Spinning Mills Limited has informed the Exchange regarding 'Pursuant to Regulation 30 read with Part A of Schedule III of SEBI (Listing Obligations and Disclosure Requirements) Regulations, 2015, please find enclosed herewith copies of Notice of the 39th Annual General Meeting published by the Company in Financial Express (English Newspaper) and Punjabi Jagran (Regional Newspaper).'.

Corporate Actions stock-summary

stock-summary
BOARD MEETING

No Upcoming Board Meetings

stock-summary
DIVIDEND

Nahar Spinning Mills Ltd has declared 20% dividend, ex-date: 04 Sep 26

stock-summary
SPLITS

No Splits history available

stock-summary
BONUS

No Bonus history available

stock-summary
RIGHTS

No Rights history available

stock-summaryKey Factors

Quality key factors stock-summary

Factor
Value
Sales Growth (5y)
4.97%
EBIT Growth (5y)
-13.95%
EBIT to Interest (avg)
3.24
Debt to EBITDA (avg)
5.63
Net Debt to Equity (avg)
0.65
Sales to Capital Employed (avg)
1.36
Tax Ratio
23.00%
Dividend Payout Ratio
29.23%
Pledged Shares
0
Institutional Holding
0.01%
ROCE (avg)
9.77%
ROE (avg)
8.26%

Valuation key factors

Factor
Value
P/E Ratio
13
Industry P/E
28
Price to Book Value
0.66
EV to EBIT
14.78
EV to EBITDA
8.74
EV to Capital Employed
0.79
EV to Sales
0.59
PEG Ratio
0.06
Dividend Yield
0.36%
ROCE (Latest)
2.65%
ROE (Latest)
5.05%

Technicals key factors

Indicator
Weekly
Monthly
MACD
Mildly Bearish
Bullish
RSI
No Signal
No Signal
Bollinger Bands
Mildly Bullish
Mildly Bullish
Moving Averages
Mildly Bullish (Daily)
KST
Mildly Bearish
Mildly Bullish
Dow Theory
Mildly Bearish
No Trend
OBV
Mildly Bearish
Bullish
stock-summary Technical Indicator Scale: Bearish, Mildly Bearish, Sideways, Mildly Bullish, Bullish  Turned 
stock-summaryShareholding
Shareholding Snapshot : Jun 2026stock-summary
Shareholding Compare (%holding) stock-summary
Majority shareholders

Promoters

Pledged Promoter Holdings

None

Mutual Funds

Held by 3 Schemes (0.01%)

FIIs

Held by 1 FIIs (0.0%)

Promoter with highest holding

Nahar Capital And Financial Services Ltd. (47.07%)

Highest Public shareholder

Anil Kumar Goel (5.14%)

Individual Investors Holdings

26.83%

stock-summaryFinancial
[
  {
    "link": "quarterly",
    "btn_text": "All Quarterly Results",
    "header": "Quarterly Results Snapshot (Standalone) - Jun'26 - YoY",
    "rhs": [
      {
        "prefix": "Net Sales ",
        "suffix": "YoY Growth in quarter ended Jun 2026 is 17.92% vs -0.19% in Jun 2025",
        "dir": 1
      },
      {
        "prefix": "Standalone Net Profit ",
        "suffix": "YoY Growth in quarter ended Jun 2026 is 337.84% vs 140.36% in Jun 2025",
        "dir": 1
      }
    ],
    "table": {
      "header": [
        "Jun'26",
        "Jun'25",
        "Change(%)"
      ],
      "body": [
        {
          "field": "Net Sales",
          "val1": "966.10",
          "val2": "819.28",
          "chgp": "17.92%",
          "chgp_class": "positive"
        },
        {
          "field": "Operating Profit (PBDIT) excl Other Income",
          "val1": "127.11",
          "val2": "57.94",
          "chgp": "119.38%",
          "chgp_class": "positive"
        },
        {
          "field": "Interest",
          "val1": "18.63",
          "val2": "17.19",
          "chgp": "8.38%",
          "chgp_class": "negative"
        },
        {
          "field": "Exceptional Items",
          "val1": "-0.02",
          "val2": "-0.23",
          "chgp": "91.30%",
          "chgp_class": "positive"
        },
        {
          "field": "Standalone Net Profit",
          "val1": "69.88",
          "val2": "15.96",
          "chgp": "337.84%",
          "chgp_class": "positive"
        },
        {
          "field": "Operating Profit Margin (Excl OI)",
          "val1": "13.16%",
          "val2": "7.07%",
          "chgp": "6.09%",
          "chgp_class": "positive"
        }
      ]
    }
  },
  {
    "link": "half-yearly",
    "btn_text": "All Half Yearly Results",
    "header": "Half Yearly Results Snapshot (Standalone) - Sep'25",
    "rhs": [
      {
        "prefix": "Net Sales ",
        "suffix": " Growth in half year ended Sep 2025 is 0.11% vs 8.13% in Sep 2024",
        "dir": -1
      },
      {
        "prefix": "Standalone Net Profit ",
        "suffix": " Growth in half year ended Sep 2025 is 204.62% vs 69.52% in Sep 2024",
        "dir": 1
      }
    ],
    "table": {
      "header": [
        "Sep'25",
        "Sep'24",
        "Change(%)"
      ],
      "body": [
        {
          "field": "Net Sales",
          "val1": "1,598.55",
          "val2": "1,596.80",
          "chgp": "0.11%",
          "chgp_class": "positive"
        },
        {
          "field": "Operating Profit (PBDIT) excl Other Income",
          "val1": "83.74",
          "val2": "57.06",
          "chgp": "46.76%",
          "chgp_class": "positive"
        },
        {
          "field": "Interest",
          "val1": "28.60",
          "val2": "38.90",
          "chgp": "-26.48%",
          "chgp_class": "positive"
        },
        {
          "field": "Exceptional Items",
          "val1": "-0.45",
          "val2": "-2.62",
          "chgp": "82.82%",
          "chgp_class": "positive"
        },
        {
          "field": "Standalone Net Profit",
          "val1": "11.32",
          "val2": "-10.82",
          "chgp": "204.62%",
          "chgp_class": "positive"
        },
        {
          "field": "Operating Profit Margin (Excl OI)",
          "val1": "5.24%",
          "val2": "3.57%",
          "chgp": "1.67%",
          "chgp_class": "positive"
        }
      ]
    }
  },
  {
    "link": "nine-monthly",
    "btn_text": "All Nine Monthly Results",
    "header": "Nine Monthly Results Snapshot (Standalone) - Dec'25",
    "rhs": [
      {
        "prefix": "Net Sales ",
        "suffix": "YoY Growth in nine months ended Dec 2025 is -4.48% vs 7.80% in Dec 2024",
        "dir": -1
      },
      {
        "prefix": "Standalone Net Profit ",
        "suffix": "YoY Growth in nine months ended Dec 2025 is 84.10% vs 80.16% in Dec 2024",
        "dir": 1
      }
    ],
    "table": {
      "header": [
        "Dec'25",
        "Dec'24",
        "Change(%)"
      ],
      "body": [
        {
          "field": "Net Sales",
          "val1": "2,301.11",
          "val2": "2,408.97",
          "chgp": "-4.48%",
          "chgp_class": "negative"
        },
        {
          "field": "Operating Profit (PBDIT) excl Other Income",
          "val1": "98.54",
          "val2": "95.22",
          "chgp": "3.49%",
          "chgp_class": "positive"
        },
        {
          "field": "Interest",
          "val1": "41.56",
          "val2": "53.91",
          "chgp": "-22.91%",
          "chgp_class": "positive"
        },
        {
          "field": "Exceptional Items",
          "val1": "-0.68",
          "val2": "-3.93",
          "chgp": "82.70%",
          "chgp_class": "positive"
        },
        {
          "field": "Standalone Net Profit",
          "val1": "-1.60",
          "val2": "-10.06",
          "chgp": "84.10%",
          "chgp_class": "positive"
        },
        {
          "field": "Operating Profit Margin (Excl OI)",
          "val1": "4.28%",
          "val2": "3.95%",
          "chgp": "0.33%",
          "chgp_class": "positive"
        }
      ]
    }
  },
  {
    "link": "annual",
    "btn_text": "All Annual Results",
    "header": "Annual Results Snapshot (Standalone) - Mar'26",
    "rhs": [
      {
        "prefix": "Net Sales ",
        "suffix": "YoY Growth in year ended Mar 2026 is -2.03% vs 7.69% in Mar 2025",
        "dir": -1
      },
      {
        "prefix": "Standalone Net Profit ",
        "suffix": "YoY Growth in year ended Mar 2026 is 76.68% vs 124.18% in Mar 2025",
        "dir": -1
      }
    ],
    "table": {
      "header": [
        "Mar'26",
        "Mar'25",
        "Change(%)"
      ],
      "body": [
        {
          "field": "Net Sales",
          "val1": "3,217.92",
          "val2": "3,284.56",
          "chgp": "-2.03%",
          "chgp_class": "negative"
        },
        {
          "field": "Operating Profit (PBDIT) excl Other Income",
          "val1": "157.49",
          "val2": "161.45",
          "chgp": "-2.45%",
          "chgp_class": "negative"
        },
        {
          "field": "Interest",
          "val1": "54.39",
          "val2": "74.20",
          "chgp": "-26.70%",
          "chgp_class": "positive"
        },
        {
          "field": "Exceptional Items",
          "val1": "-0.91",
          "val2": "-5.24",
          "chgp": "82.63%",
          "chgp_class": "positive"
        },
        {
          "field": "Standalone Net Profit",
          "val1": "21.82",
          "val2": "12.35",
          "chgp": "76.68%",
          "chgp_class": "positive"
        },
        {
          "field": "Operating Profit Margin (Excl OI)",
          "val1": "4.89%",
          "val2": "4.92%",
          "chgp": "-0.03%",
          "chgp_class": "negative"
        }
      ]
    }
  }
]

Quarterly Results Snapshot (Standalone) - Jun'26 - YoYstock-summary

Jun'26
Jun'25
Change(%)
Net Sales
966.10
819.28
17.92%
Operating Profit (PBDIT) excl Other Income
127.11
57.94
119.38%
Interest
18.63
17.19
8.38%
Exceptional Items
-0.02
-0.23
91.30%
Standalone Net Profit
69.88
15.96
337.84%
Operating Profit Margin (Excl OI)
13.16%
7.07%
6.09%
Values in Rs Cr.
Direction Arrows
Net Sales

YoY Growth in quarter ended Jun 2026 is 17.92% vs -0.19% in Jun 2025

Direction Arrows
Standalone Net Profit

YoY Growth in quarter ended Jun 2026 is 337.84% vs 140.36% in Jun 2025

Half Yearly Results Snapshot (Standalone) - Sep'25stock-summary

Sep'25
Sep'24
Change(%)
Net Sales
1,598.55
1,596.80
0.11%
Operating Profit (PBDIT) excl Other Income
83.74
57.06
46.76%
Interest
28.60
38.90
-26.48%
Exceptional Items
-0.45
-2.62
82.82%
Standalone Net Profit
11.32
-10.82
204.62%
Operating Profit Margin (Excl OI)
5.24%
3.57%
1.67%
Values in Rs Cr.
Direction Arrows
Net Sales

Growth in half year ended Sep 2025 is 0.11% vs 8.13% in Sep 2024

Direction Arrows
Standalone Net Profit

Growth in half year ended Sep 2025 is 204.62% vs 69.52% in Sep 2024

Nine Monthly Results Snapshot (Standalone) - Dec'25stock-summary

Dec'25
Dec'24
Change(%)
Net Sales
2,301.11
2,408.97
-4.48%
Operating Profit (PBDIT) excl Other Income
98.54
95.22
3.49%
Interest
41.56
53.91
-22.91%
Exceptional Items
-0.68
-3.93
82.70%
Standalone Net Profit
-1.60
-10.06
84.10%
Operating Profit Margin (Excl OI)
4.28%
3.95%
0.33%
Values in Rs Cr.
Direction Arrows
Net Sales

YoY Growth in nine months ended Dec 2025 is -4.48% vs 7.80% in Dec 2024

Direction Arrows
Standalone Net Profit

YoY Growth in nine months ended Dec 2025 is 84.10% vs 80.16% in Dec 2024

Annual Results Snapshot (Standalone) - Mar'26stock-summary

Mar'26
Mar'25
Change(%)
Net Sales
3,217.92
3,284.56
-2.03%
Operating Profit (PBDIT) excl Other Income
157.49
161.45
-2.45%
Interest
54.39
74.20
-26.70%
Exceptional Items
-0.91
-5.24
82.63%
Standalone Net Profit
21.82
12.35
76.68%
Operating Profit Margin (Excl OI)
4.89%
4.92%
-0.03%
Values in Rs Cr.
Direction Arrows
Net Sales

YoY Growth in year ended Mar 2026 is -2.03% vs 7.69% in Mar 2025

Direction Arrows
Standalone Net Profit

YoY Growth in year ended Mar 2026 is 76.68% vs 124.18% in Mar 2025

stock-summaryCompany CV
About Nahar Spinning Mills Ltd stock-summary
stock-summary
Nahar Spinning Mills Ltd
Micro Cap
Garments & Apparels
Nahar Spinning Mills Limited incorporated as a Private Limited Company in December, 1980 which became a Public Limited Company in 1983. The Company is engaged in the business of manufacture of cotton yarn/blended and synthetic yarn and hosiery knitwears. The Company's units are located at various places in Ludhiana. It has its own dyeing unit, equipped with modern machinery, at Ludhiana. It set up a new spinning unit to manufacture cotton/synthetic yarn at Simrai, Mandideep, Madhya Pradesh.
Company Coordinates stock-summary
Company Details
373 Industrial Area A, Nahar Tower Ludhiana Punjab : 141003
stock-summary
Tel: 91-0161-2600701 to 2600705
stock-summary
secnsm@owmnahar.com
Registrar Details