
Compare Nahar Spinning with Similar Stocks
Dashboard
Weak Long Term Fundamental Strength with a -9.96% CAGR growth in Operating Profits over the last 5 years
- Low ability to service debt as the company has a high Debt to EBITDA ratio of 6.24 times
- The company has been able to generate a Return on Equity (avg) of 8.26% signifying low profitability per unit of shareholders funds
Flat results in Mar 26
With ROCE of 2.7, it has a Attractive valuation with a 0.8 Enterprise value to Capital Employed
Despite the size of the company, domestic mutual funds hold only 0.03% of the company
Stock DNA
Garments & Apparels
INR 1,028 Cr (Micro Cap)
45.00
26
0.35%
0.65
1.50%
0.68
Total Returns (Price + Dividend) 
Latest dividend: 1 per share ex-dividend date: Sep-04-2025
Risk Adjusted Returns v/s
Returns Beta

News

Broad-Based Technical Strength Lifts Nahar Spinning Mills Ltd to 52-Week High of Rs 295
Surging to a fresh 52-week high of Rs 295 on 20 Jul 2026, Nahar Spinning Mills Ltd has demonstrated remarkable price momentum, extending gains for eight consecutive sessions and outperforming its sector by 2.74% today despite a broadly negative market backdrop.
Read full news article
Nahar Spinning Mills Ltd is Rated Hold by MarketsMOJO
Nahar Spinning Mills Ltd is rated 'Hold' by MarketsMOJO, with this rating last updated on 06 July 2026. However, the analysis and financial metrics discussed here reflect the stock's current position as of 18 July 2026, providing investors with the latest insights into its performance and outlook.
Read full news article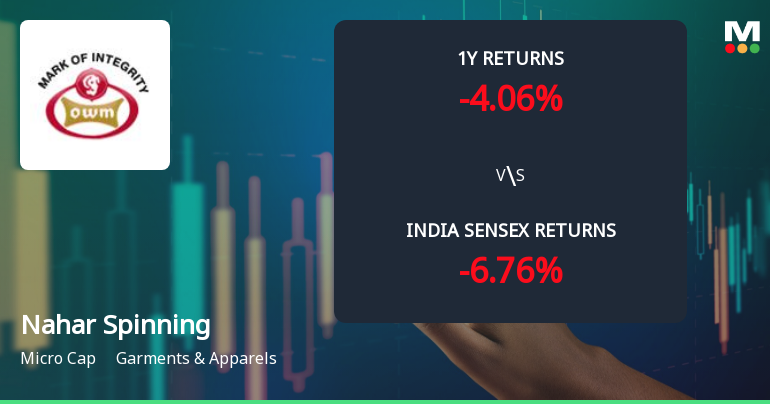
Nahar Spinning Mills Ltd Technical Momentum Shifts Signal Bullish Outlook
Nahar Spinning Mills Ltd has witnessed a notable shift in its technical momentum, with key indicators signalling a transition from mildly bullish to a more confident bullish stance. This change, coupled with a recent upgrade in its Mojo Grade from Sell to Hold, reflects improving market sentiment for the micro-cap garment and apparel company amid mixed broader market conditions.
Read full news article Announcements
Nahar Spinning Mills Limited - Outcome of Board Meeting
13-Nov-2019 | Source : NSENahar Spinning Mills Limited has informed the Exchange regarding Board meeting held on November 11, 2019.
Disclosure under SEBI Takeover Regulations
11-Sep-2019 | Source : NSE
| Nahar Capital and Financial Services Ltd has submitted to the Exchange, vide letter dated September 11 , 2019 a copy of disclosure under Regulation 10(6) in respect of acquisition under Regulation 10 of SEBI (Substantial Acquisition of Shares & Takeovers) Regulations, 2011. |
Updates
10-Sep-2019 | Source : NSE
| Nahar Spinning Mills Limited has informed the Exchange regarding 'Pursuant to Regulation 30 read with Part A of Schedule III of SEBI (Listing Obligations and Disclosure Requirements) Regulations, 2015, please find enclosed herewith copies of Notice of the 39th Annual General Meeting published by the Company in Financial Express (English Newspaper) and Punjabi Jagran (Regional Newspaper).'. |
Corporate Actions

No Upcoming Board Meetings

Nahar Spinning Mills Ltd has declared 20% dividend, ex-date: 04 Sep 25

No Splits history available

No Bonus history available

No Rights history available
Quality key factors
Valuation key factors
Technicals key factors
 Technical Indicator Scale: Bearish, Mildly Bearish, Sideways, Mildly Bullish, Bullish Turned
 Shareholding Snapshot : Jun 2026
Shareholding Compare (%holding)
Promoters
None
Held by 3 Schemes (0.01%)
Held by 1 FIIs (0.0%)
Nahar Capital And Financial Services Ltd. (47.07%)
Anil Kumar Goel (5.14%)
26.83%
Quarterly Results Snapshot (Standalone) - Mar'26 - YoY

YoY Growth in quarter ended Mar 2026 is 4.71% vs 7.38% in Mar 2025
YoY Growth in quarter ended Mar 2026 is 4.51% vs 6,156.76% in Mar 2025
Half Yearly Results Snapshot (Standalone) - Sep'25
Growth in half year ended Sep 2025 is 0.11% vs 8.13% in Sep 2024

Growth in half year ended Sep 2025 is 204.62% vs 69.52% in Sep 2024
Nine Monthly Results Snapshot (Standalone) - Dec'25
YoY Growth in nine months ended Dec 2025 is -4.48% vs 7.80% in Dec 2024
YoY Growth in nine months ended Dec 2025 is 84.10% vs 80.16% in Dec 2024
Annual Results Snapshot (Standalone) - Mar'26
YoY Growth in year ended Mar 2026 is -2.03% vs 7.69% in Mar 2025
YoY Growth in year ended Mar 2026 is 76.68% vs 124.18% in Mar 2025
About Nahar Spinning Mills Ltd

Company Coordinates


