
Compare Naksh Precious with Similar Stocks
Dashboard
With a Operating Losses, the company has a Weak Long Term Fundamental Strength
- Poor long term growth as Operating profit has grown by an annual rate -24.79% of over the last 5 years
- Low ability to service debt as the company has a high Debt to EBITDA ratio of 0.28 times
Negative results in Mar 26
Risky - Negative EBITDA
Consistent Underperformance against the benchmark over the last 3 years
Stock DNA
Automobiles
INR 4 Cr (Micro Cap)
NA (Loss Making)
21
0.00%
-0.28
-7.59%
0.69
Total Returns (Price + Dividend) 
Naksh Precious for the last several years.
Risk Adjusted Returns v/s
Returns Beta

News
Are Naksh Precious Metals Ltd latest results good or bad?
The latest financial results for Naksh Precious Metals Ltd reveal significant operational challenges and a troubling financial trajectory. In Q4 FY26, the company reported a consolidated net profit of -₹0.59 crores, marking a substantial decline from the previous quarter. Net sales were recorded at ₹0.34 crores, which remained largely unchanged compared to ₹0.35 crores in Q3 FY26, indicating persistent difficulties in revenue generation. The operating profit margins turned deeply negative at -232.35%, a stark contrast to the positive margin of 25.71% in the preceding quarter. This dramatic shift underscores severe operational distress within the company. The profit after tax margin also deteriorated to -173.53%, highlighting the extent of the financial difficulties faced. Year-on-year comparisons show that while net sales exhibited a notable growth of 750.00% compared to Q4 FY25, the absolute revenue figu...
Read full news article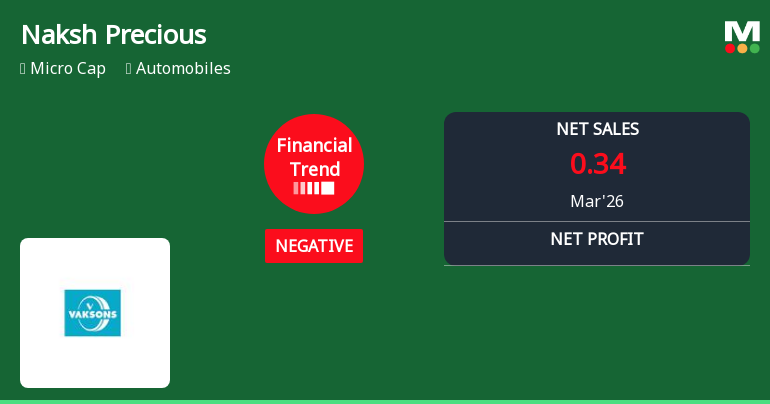
Naksh Precious Metals Ltd Reports Negative Financial Trend Amidst Industry Challenges
Naksh Precious Metals Ltd, a micro-cap player in the automobile sector, has reported a significant deterioration in its financial performance for the quarter ended March 2026. The company’s financial trend has shifted from flat to negative, reflecting mounting operational challenges and a weakening profitability profile. This downturn comes amid a broader sectoral pressure and contrasts sharply with the broader market indices.
Read full news article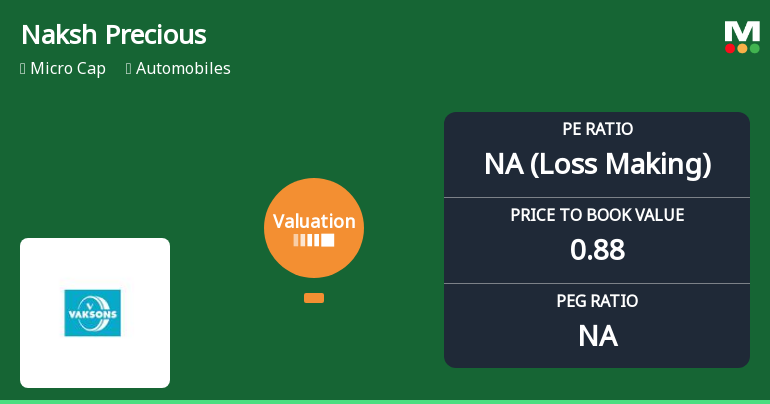
Naksh Precious Metals Ltd Faces Valuation Reassessment Amidst Market Challenges
Naksh Precious Metals Ltd, a micro-cap player in the automobiles sector, has experienced a significant shift in its valuation parameters, moving from an expensive to a risky classification. This change, coupled with a sharp decline in share price and deteriorating financial metrics, raises concerns about the stock’s price attractiveness relative to its historical and peer averages.
Read full news article Announcements
Announcement under Regulation 30 (LODR)-Newspaper Publication
02-Jun-2026 | Source : BSENewspaper Advertisement under Regulation 47 read with Regulation 33 of SEBI (LODR) Regulations 2015
Compliances-Reg.24(A)-Annual Secretarial Compliance
30-May-2026 | Source : BSECompliance under Regulation 24 (A) of SEBI (LODR) Regulations 2015
Board Meeting Outcome for Outcome Of Board Meeting Held On Saturday May 30 2026
30-May-2026 | Source : BSE1. The Audited Financial Results set out in compliance with Indian Accounting Standards (Ind - AS) for the Half Year and Year ended March 31 2026 together with Statement of Assets & Liabilities and Cash Flow Statement and Auditors Report thereon. 2. The Audited Consolidated Financial Results set out in compliance with Indian Accounting Standards (Ind - AS) for the Half year and year ended March 31 2026 together with Statement of Assets & Liabilities and Cash Flow Statement
Corporate Actions

No Upcoming Board Meetings

No Dividend history available

No Splits history available

Naksh Precious Metals Ltd has announced 3:5 bonus issue, ex-date: 15 Oct 20

No Rights history available
Quality key factors
Valuation key factors
Technicals key factors
 Technical Indicator Scale: Bearish, Mildly Bearish, Sideways, Mildly Bullish, Bullish Turned
 Shareholding Snapshot : Mar 2026
Shareholding Compare (%holding)
Non Institution
None
Held by 0 Schemes
Held by 0 FIIs
Sneha Sachin Vispute (21.04%)
None
67.37%
Quarterly Results Snapshot (Standalone) - Mar'26 - YoY

YoY Growth in quarter ended Mar 2026 is -33.33% vs 2,450.00% in Mar 2025
YoY Growth in quarter ended Mar 2026 is -1,280.00% vs 0.00% in Mar 2025
Half Yearly Results Snapshot (Standalone) - Sep'25
Growth in half year ended Sep 2025 is -37.74% vs 1,414.29% in Sep 2024
Growth in half year ended Sep 2025 is -39.13% vs 2,400.00% in Sep 2024
Nine Monthly Results Snapshot (Standalone) - Dec'25
YoY Growth in nine months ended Dec 2025 is -45.11% vs 2,528.57% in Dec 2024
YoY Growth in nine months ended Dec 2025 is -48.78% vs 0.00% in Dec 2024
Annual Results Snapshot (Consolidated) - Mar'26
Not Applicable: The company has declared_date for only one period
Not Applicable: The company has declared_date for only one period
About Naksh Precious Metals Ltd

Company Coordinates


