
 Price Point
Compare Natco Pharma with Similar Stocks
ScoreDashboard
High Management Efficiency with a high ROE of 16.25%
The company is Net-Debt Free
Negative results in Dec 25
With ROE of 17.8, it has a Attractive valuation with a 2.1 Price to Book Value
High Institutional Holdings at 22.83%
Market Beating performance in long term as well as near term
Mojo ParametersStock DNA

Pharmaceuticals & Biotechnology

INR 21,264 Cr (Small Cap)

12.00
34

0.43%

-0.34

17.79%

2.43
Total ReturnsTotal Returns (Price + Dividend) 
Latest dividend: 1.5 per share ex-dividend date: Feb-18-2026
Risk Adjusted Returns v/s
Returns Beta
 News & Corporate Actions
News
Are Natco Pharma Ltd. latest results good or bad?
Natco Pharma Ltd.'s latest financial results for Q4 FY26 reveal a complex picture of operational performance. The company reported a net profit of ₹267.90 crores, which reflects a significant quarter-on-quarter growth of 76.83%. However, this figure is accompanied by a year-on-year decline of 34.11%, indicating challenges in sustaining profitability over a longer period. Net sales for the quarter reached ₹739.10 crores, marking a 14.18% increase from the previous quarter, yet this is overshadowed by a substantial year-on-year decrease of 39.47%. This suggests that while there may be some recovery from the previous quarter, the overall trend remains concerning, particularly given the sharp decline in sales compared to the same quarter last year. The operating margin, excluding other income, fell to 17.26%, which is noted as a multi-quarter low. This decline in operating margin indicates significant pressu...
Read full news article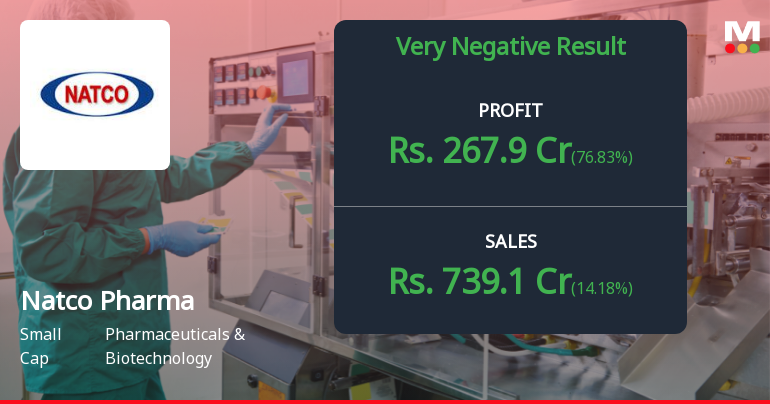
Natco Pharma Q4 FY26: Sharp Revenue Decline Overshadows Tax Reversal Gains
Natco Pharma Ltd. reported consolidated net profit of ₹267.90 crores for the quarter ended March 2026, marking a sharp 76.83% quarter-on-quarter surge but a concerning 34.11% year-on-year decline. The Hyderabad-based pharmaceutical manufacturer, with a market capitalisation of ₹21,264 crores, witnessed its stock plummet 13.51% following the results announcement, closing at ₹1,016.75 on May 29, 2026. The quarter's performance reveals a troubling divergence: whilst net profit appeared robust due to a significant tax reversal, core operational metrics deteriorated substantially, with revenues declining 39.47% year-on-year to ₹739.10 crores and operating margins compressing to multi-quarter lows.
Read full news article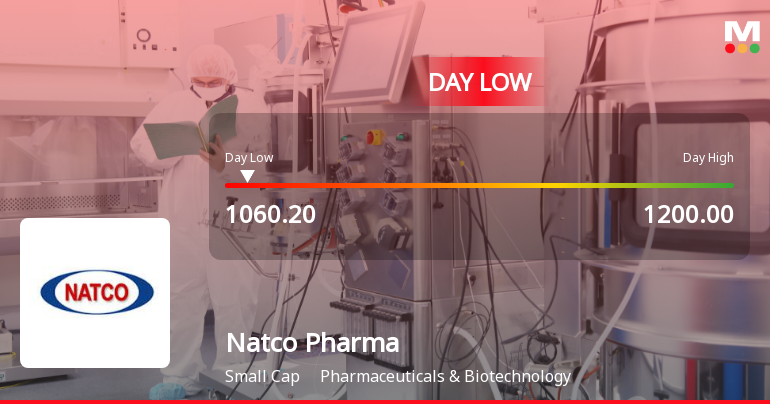
Natco Pharma Ltd. Hits Intraday Low Amid Price Pressure on 29 May 2026
Natco Pharma Ltd. experienced a notable decline today, hitting an intraday low of Rs 1085.4, reflecting a sharp price correction amid broader market weakness and sector underperformance. The stock closed with a significant loss, underperforming both its sector and the benchmark Sensex.
Read full news article Announcements
Board Meeting Outcome for Audited Financial Results For The Quarter And Year Ended 31St March 2026
29-May-2026 | Source : BSEAudited Financial Results for the quarter and year ended 31st March 2026
Announcement under Regulation 30 (LODR)-Investor Presentation
29-May-2026 | Source : BSEFY26 Earnings Call Investor Presentation
Audited Financial Results For The Quarte And Year Ended 31St March 2026
29-May-2026 | Source : BSEAudited Financial Results for the quarter and year ended 31st March 2026
Corporate Actions

No Upcoming Board Meetings

Natco Pharma Ltd. has declared 75% dividend, ex-date: 18 Feb 26

Natco Pharma Ltd. has announced 2:10 stock split, ex-date: 26 Nov 15

No Bonus history available

No Rights history available
Key FactorsQuality key factors
Valuation key factors
Technicals key factors
 Technical Indicator Scale: Bearish, Mildly Bearish, Sideways, Mildly Bullish, Bullish Turned Shareholding
Shareholding Snapshot : Mar 2026
Shareholding Compare (%holding)
Promoters
None
Held by 21 Schemes (1.72%)
Held by 234 FIIs (17.37%)
V C Nannapaneni (15.66%)
Belgrave Investment Fund (2.31%)
23.34%
FinancialQuarterly Results Snapshot (Consolidated) - Mar'26 - QoQ
 Compare with Peers
QoQ Growth in quarter ended Mar 2026 is 14.18% vs -52.51% in Dec 2025
QoQ Growth in quarter ended Mar 2026 is 76.83% vs -70.78% in Dec 2025

Half Yearly Results Snapshot (Consolidated) - Sep'25

Growth in half year ended Sep 2025 is -1.53% vs 25.87% in Sep 2024
Growth in half year ended Sep 2025 is -25.76% vs 70.51% in Sep 2024
Nine Monthly Results Snapshot (Consolidated) - Dec'25
YoY Growth in nine months ended Dec 2025 is 4.07% vs 9.49% in Dec 2024
YoY Growth in nine months ended Dec 2025 is -22.19% vs 47.58% in Dec 2024
Annual Results Snapshot (Consolidated) - Mar'26
YoY Growth in year ended Mar 2026 is -7.93% vs 10.77% in Mar 2025
YoY Growth in year ended Mar 2026 is -24.76% vs 35.81% in Mar 2025
 Company CV
About Natco Pharma Ltd.

Company Coordinates










