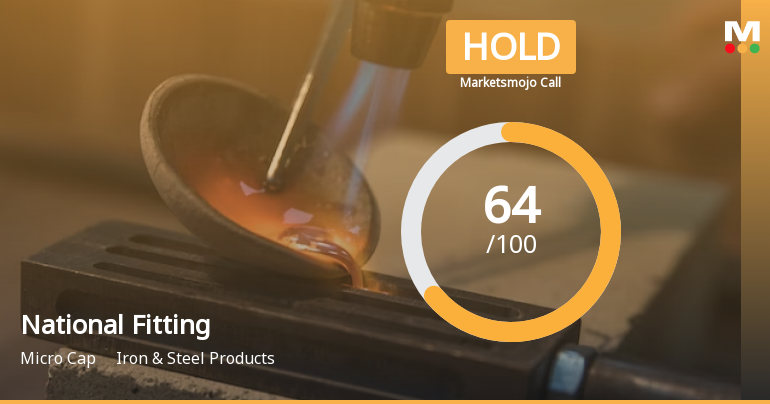
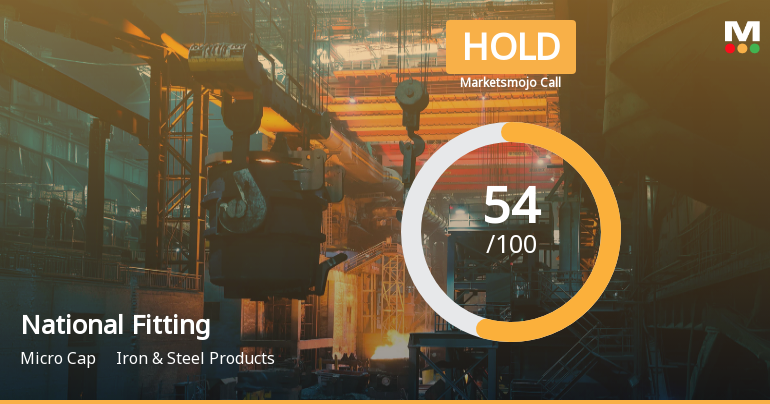
National Fitting

  • Market Cap: Micro Cap
  • Industry: Iron & Steel Products
  • ISIN: INE643C01015
  • NSEID:
  • BSEID: 531289
INR
231.85
11 (4.98%)
BSENSE

Sep 02, 03:30 PM

BSE+NSE Vol: 69.57 k

  • Price Points
  • Score
  • Mojo Parameters
  • Total Return
  • News and Corporate Actions
  • Key factors
  • Shareholding
  • Financials
  • CompanyCV
stock-summaryPrice Point
High/Low

1Day

52 Week

Valuation
Technical
Day's Volume

CASH

69.57 k (-7.01%) Volume

Shareholding (Jun 2026)

FII

0.00%

Held by 0 FIIs

DII

0.01%

Held by 0 DIIs

Promoter

34.27%

Why is National Fittings Ltd falling/rising?

02-Sep-2026

As of 01-Sep, National Fittings Ltd's stock price is rising to 220.85, reflecting a 4.99% increase. This rise is driven by strong recent performance, positive trading indicators, and increased investor participation.

As of 01-Sep, National Fittings Ltd's stock price is rising, currently at 220.85, reflecting an increase of 10.5 (4.99%). This upward movement is supported by several factors. The stock has shown strong performance over various periods, with a notable 31.03% increase over the past week and a 48.47% rise over the past month, significantly outperforming the Sensex, which has declined by 0.92% and 1.47% respectively during the same periods.<BR><BR>Today, the stock opened with a gain of 4.99% and has maintained this price throughout the trading session, indicating strong demand. It has been on a consecutive gain streak for the last six days, accumulating a total return of 35.28% during this period. Additionally, National Fittings Ltd is trading above its 5-day, 20-day, 50-day, 100-day, and 200-day moving averages, which suggests a bullish trend.<BR><BR>Investor participation has also increased, with a delivery volume of 64.73k on August 31, marking a 24.98% rise compared to the 5-day average. This indicates growing interest and confidence among investors in the stock, contributing to its price rise. Overall, the combination of strong recent performance, positive trading indicators, and increased investor participation are key reasons for the rising stock price of National Fittings Ltd.

View full answer

Who are in the management team of National Fitting?

01-Sep-2026

The management team of National Fitting includes A V Palaniswamy (Managing Director), R Alagar and Chenniappan Selvakumar (Non-Executive & Independent Directors), S Aravinthan (Company Secretary), and Whole-time Directors Amburose Panath Anitha and Jayaram Govindarajan, along with Independent Director Susheela Baiakrishnan.

The management team of National Fitting includes the following individuals:<BR><BR>1. A V Palaniswamy - Managing Director<BR>2. R Alagar - Non-Executive & Independent Director<BR>3. S Aravinthan - Company Secretary & Compliance Officer<BR>4. Amburose Panath Anitha - Whole-time Director<BR>5. Jayaram Govindarajan - Whole-time Director<BR>6. Chenniappan Selvakumar - Non-Executive & Independent Director<BR>7. Susheela Baiakrishnan - Independent Director<BR><BR>If you need more specific information about any of these members or their roles, feel free to ask!

View full answer

What does National Fitting do?

01-Sep-2026

National Fittings Ltd manufactures SG Iron and Stainless Pipe Fittings and Ball Valves, operating in the Iron & Steel Products industry. As of June 2026, it reported net sales of 27 Cr and a net profit of 4 Cr, with a market cap of INR 191 Cr.

Overview: <BR>National Fittings Ltd manufactures and markets SG Iron Grooved and Screwed Pipe Fittings, Stainless Pipe Fittings, and Ball Valves, operating within the Iron & Steel Products industry and classified as a Micro Cap company.<BR><BR>History: <BR>National Fittings Limited was initially incorporated as 'Interfit Techno Products Limited' in 1993. The company changed its name to 'National Fittings Limited' in 2013. The latest quarterly results report net sales and net profit for June 2026.<BR><BR>Financial Snapshot: <BR>Net Sales: 27 Cr (Quarterly Results - Jun 2026) <BR>Net Profit: 4 Cr (Quarterly Results - Jun 2026) <BR>Market-cap: INR 191 Cr (Micro Cap)<BR><BR>Key Metrics: <BR>P/E: 18.00 <BR>Industry P/E: 50 <BR>Dividend Yield: 0.48% <BR>Debt Equity: -0.39 <BR>Return on Equity: 11.71% <BR>Price to Book: 1.94<BR><BR>Contact Details: <BR>Address: SF No 112 Madhapur Road, Kaniyur Village Karumathampatt Coimbatore Tamil Nadu : 641659 <BR>Tel: 91 99432 93000 <BR>Email: admin@naionalfitting.com <BR>Website: http://www.nationalfitting.com

View full answer

Who are the peers of the National Fitting?

01-Sep-2026

National Fitting's peers include Shah Alloys, Rudra Global, Bansal Roofing, and others, with varying management risks and growth ratings. National Fitting has an average management risk, excellent capital structure, and a 1-year return of 22.65%, while Shah Alloys leads in returns at 89.92%.

Peers: The peers of National Fitting are Shah Alloys, Rudra Global, Bansal Roofing, Vibhor Steel, Sh. Bajrang All., Incredible Indus, Maiden Forgings, Jay Bee Laminati, Surani Steel Tub, and Kritika Wires.<BR><BR>Quality Snapshot: Excellent management risk is observed at Bansal Roofing and Jay Bee Laminati, while Average management risk is found at National Fitting, Shah Alloys, and Rudra Global. Below Average management risk is noted at Vibhor Steel, Sh. Bajrang All., Incredible Indus, Maiden Forgings, Surani Steel Tub, and Kritika Wires. Growth ratings show that Bansal Roofing has Good growth, while Average growth is seen at National Fitting, Shah Alloys, Rudra Global, and Jay Bee Laminati. The rest have Below Average growth. For Capital Structure, National Fitting stands out with Excellent, while Good is noted at Bansal Roofing and Jay Bee Laminati, and the rest have Below Average.<BR><BR>Return Snapshot: Shah Alloys has the highest 1-year return at 89.92%, while Rudra Global has the lowest at -31.45%. National Fitting's 1-year return of 22.65% is significantly higher than Rudra Global's. Additionally, Incredible Indus, Vibhor Steel, Sh. Bajrang All., and Surani Steel Tub all have negative six-month returns.

View full answer

How big is National Fitting?

01-Sep-2026

As of 31st August, National Fittings Ltd has a market capitalization of 191.00 Cr, with recent net sales of 45.02 Cr and a net profit of 4.35 Cr. The company's shareholder's funds are 89.05 Cr, and total assets amount to 119.84 Cr as of March 2026.

As of 31st August, National Fittings Ltd has a market capitalization of 191.00 Cr, categorizing it as a Micro Cap company.<BR><BR>In the latest three quarters, the company reported Net Sales of 45.02 Cr and a Net Profit of 4.35 Cr. This reflects the financial performance over the periods ending in December 2018, September 2018, and June 2018.<BR><BR>The latest annual period for the balance sheet is March 2026, showing Shareholder's Funds of 89.05 Cr and Total Assets of 119.84 Cr.

View full answer

Should I buy, sell or hold National Fittings Ltd?

13-Aug-2026

When is the next results date for National Fittings Ltd?

30-Jul-2026

The next results date for National Fittings Ltd is 05 August 2026.

The next results date for National Fittings Ltd is scheduled for 05 August 2026.

View full answer

Are National Fittings Ltd latest results good or bad?

04-Feb-2026

National Fittings Ltd's latest results show strong profit growth and record revenue, but concerns about declining operating margins and reliance on non-operating income suggest a cautious outlook. Investors should monitor future performance for signs of improved operational efficiency.

National Fittings Ltd's latest results present a mixed picture. On one hand, the company reported a significant increase in net profit for Q3 FY26, reaching ₹2.93 crores, which is a remarkable 181.70% increase year-on-year. Additionally, revenue grew by 12.63%, marking the highest quarterly revenue in the company’s history at ₹23.64 crores.<BR><BR>However, there are notable concerns regarding the quality of these earnings. The operating margin has deteriorated sharply to 8.88%, down from 13.84% a year ago, indicating operational challenges. Furthermore, a substantial portion of the profit before tax—35.62%—came from other income, raising questions about the sustainability of the profit growth derived from core operations.<BR><BR>While the stock has rallied recently, reflecting some investor optimism, the longer-term performance has been less favorable, with negative returns over the past three and six months. The company's current valuation metrics suggest it is trading at a discount compared to peers, but the underlying operational issues and reliance on non-operating income could justify this discount.<BR><BR>In summary, while the latest results show strong profit growth and revenue performance, the significant margin compression and concerns over earnings quality suggest a cautious outlook. Investors may want to monitor upcoming quarters closely to assess whether the company can stabilize its margins and improve operational efficiency.

View full answer

How has been the historical performance of National Fitting?

12-Nov-2025

National Fitting has shown steady growth, with profit before tax increasing from 11.97 Cr in March 2018 to 26.00 Cr in March 2025, and cash flow from operations reaching 8.00 Cr. By March 2025, total assets and cash equivalents rose significantly, reflecting a strong financial position.

Answer:<BR>The historical performance of National Fitting shows a steady growth trajectory over the years, particularly highlighted in the financial year ending March 2025.<BR><BR>Breakdown:<BR>In March 2018, National Fitting reported net sales of 61.85 Cr, with total operating income also at 61.85 Cr. The total expenditure, excluding depreciation, was 48.99 Cr, leading to an operating profit (PBDIT) of 15.38 Cr. The profit before tax stood at 11.97 Cr, resulting in a profit after tax of 7.51 Cr, which corresponds to a PAT margin of 12.15%. By March 2025, the company demonstrated significant growth, with profit before tax increasing to 26.00 Cr. The total assets rose to 102.80 Cr, while total liabilities were recorded at 102.80 Cr as well. Cash flow from operating activities showed a positive trend, reaching 8.00 Cr in March 2025, and the closing cash and cash equivalents surged to 44.00 Cr. The book value per share also improved significantly, reaching 89.15 by March 2025, indicating a robust financial position and operational efficiency over the years.

View full answer

Is National Fitting overvalued or undervalued?

10-Oct-2025

As of October 9, 2025, National Fitting's valuation has shifted from attractive to fair, with a PE ratio of 22.01 and strong year-to-date performance of 44.35%, indicating it is reasonably priced relative to growth potential despite a more cautious outlook.

As of 9 October 2025, the valuation grade for National Fitting has moved from attractive to fair, indicating a shift in its perceived value. The company appears to be fairly valued at this time. Key ratios include a PE ratio of 22.01, an EV to EBITDA of 12.57, and a PEG ratio of 0.46, which suggests that the stock may be reasonably priced relative to its growth potential.<BR><BR>In comparison to its peers, National Fitting's PE ratio aligns closely with Bharat Forge at 56.41 and Ramkrishna Forging at 27.85, both of which are also rated fair, while CIE Automotive, rated attractive, has a lower PE of 20.14. Additionally, National Fitting has outperformed the Sensex significantly over various periods, with a year-to-date return of 44.35% compared to the Sensex's 5.16%. This strong performance may indicate investor confidence, but the recent grade change suggests a more cautious outlook moving forward.

View full answer

What is the technical trend for National Fitting?

09-Jun-2025

As of June 4, 2025, National Fitting's technical trend is bullish, supported by positive MACD and Bollinger Bands indicators, although the KST shows a mildly bearish signal on the monthly chart.

As of 4 June 2025, the technical trend for National Fitting has changed from mildly bullish to bullish. The weekly and monthly MACD indicators are both bullish, supporting the positive trend. Bollinger Bands also indicate a bullish stance on both time frames. The daily moving averages confirm a bullish outlook as well. However, the KST shows a mildly bearish signal on the monthly chart, and Dow Theory indicates no clear trend on both weekly and monthly levels. Overall, the current technical stance is bullish with moderate strength, driven primarily by the MACD and Bollinger Bands.

View full answer

Who are the top shareholders of the National Fitting?

06-Jun-2025

The top shareholder of National Fitting is Ackanaickenpalayam Venkataswamy Palaniswamy with 34.04%, followed by Kumudha Palaniswamy at 7.37%. Individual investors hold 41.28%, with no pledged promoter holdings or foreign institutional investors involved.

The top shareholders of National Fitting include Ackanaickenpalayam Venkataswamy Palaniswamy, who holds the largest stake at 34.04%. Following him, the highest public shareholder is Kumudha Palaniswamy with a 7.37% holding. Additionally, individual investors collectively hold 41.28% of the shares. There are no pledged promoter holdings, and the company does not have any foreign institutional investors (FIIs) involved. The only mutual fund investment is from one scheme, which holds a minimal 0.01%.

View full answer

Has National Fitting declared dividend?

06-Jun-2025

Yes, National Fittings Ltd has declared a 15% dividend, amounting to 1.5 per share, with an ex-date of August 30, 2024. The company has shown strong total returns across various periods, with a total return of 469.46% over the past five years.

National Fittings Ltd has declared a 15% dividend.<BR><BR>Dividend Details:<BR>- Percentage announced: 15%<BR>- Amount per share: 1.5<BR>- Ex-date: Aug-30-2024<BR><BR>Dividend Yield: 0.81%.<BR><BR>Total Returns by Period:<BR>In the 6-month period, the price return was 21.13%, with a dividend return of 0%, resulting in a total return of 21.13%.<BR><BR>For the 1-year period, the price return was 42.46%, the dividend return was 1.19%, leading to a total return of 43.65%.<BR><BR>Over the 2-year period, the price return was 83.44%, the dividend return was 3.31%, culminating in a total return of 86.75%.<BR><BR>In the 3-year period, the price return reached 210.59%, with a dividend return of 7.81%, resulting in a total return of 218.4%.<BR><BR>For the 4-year period, the price return was 261.69%, the dividend return was 6.46%, leading to a total return of 268.15%.<BR><BR>In the 5-year period, the price return was 457.0%, with a dividend return of 12.46%, resulting in a total return of 469.46%.<BR><BR>Overall, National Fittings Ltd has declared a significant dividend while also demonstrating strong total returns across all periods, indicating a positive financial performance for the company.

View full answer
iScoreScore
Click here to find our call on this stock
Strong Sell
Sell
Hold
Buy
Strong Buy

Dashboard

1

Company has a Debt to Equity ratio (avg) of 0.08 times

  • PAT(Q) At Rs 3.94 cr has Grown at 50.4%
  • NET SALES(Q) Highest at Rs 27.13 cr
  • PBDIT(Q) Highest at Rs 5.34 cr.
2

With ROE of 11.7, it has a Attractive valuation with a 2.4 Price to Book Value

3

Majority shareholders : Non Institution

 
4

Market Beating performance in long term as well as near term

stock-summaryMojo Parameters

Mojo Parameters

Loading Valuation Snapshot...

Stock DNA

stock-summary
Industry

Iron & Steel Products

stock-summary
Market cap

INR 211 Cr (Micro Cap)

stock-summary
P/E

20.00

stock-summary
Industry P/E

50

stock-summary
Dividend Yield

0.41%

stock-summary
Debt Equity

-0.39

stock-summary
Return on Equity

11.71%

stock-summary
Price to Book

2.25

Revenue and Profits:
Net Sales:
27 Cr
(Quarterly Results - Jun 2026)
Net Profit:
4 Cr
stock-summaryTotal Returns
Total Returns (Price + Dividend) stock-summary
Dividend Yield (0.41%)
TimePeriod
Price Return
Dividend Return
Total Return
3 Months
48.1%
0.65%
48.75%
6 Months
44.91%
0.62%
45.53%
1 Year
34.02%
1.13%
35.15%
2 Years
65.61%
1.43%
67.04%
3 Years
76.04%
3.08%
79.12%
4 Years
296.66%
8.38%
305.04%
5 Years
322.7%
11.04%
333.74%

Latest dividend: 1 per share ex-dividend date: Sep-12-2025

Risk Adjusted Returns v/s stock-summary
Returns Beta
Icon
Beta has not been calculated since enough price history is not available
stock-summaryNews & Corporate Actions

News

National Fittings Ltd Gains 14.52%: 4 Key Factors Driving the Week’s Rally

Announcements stock-summary

33Rd Annual General Meeting - Notice

20-Aug-2026 | Source : BSE

Sir

Reg. 34 (1) Annual Report.

18-Aug-2026 | Source : BSE

We are submitting the Annual report of the 33rd Annual General Meeting of the shareholders t be held on Wednesday 16th September 2026

33Rd Annual General Meeting - 16.09.2026

05-Aug-2026 | Source : BSE

We are scheduled the 33rd Annual General Meeting of the shareholders on Wednesday 16th September 2026 and the Book closure starts from 10.09.2026 to 16.09.2026 with a record date of 09.09.2026

Corporate Actions stock-summary

stock-summary
BOARD MEETING

No Upcoming Board Meetings

stock-summary
DIVIDEND

National Fittings Ltd has declared 10% dividend, ex-date: 09 Sep 26

stock-summary
SPLITS

No Splits history available

stock-summary
BONUS

No Bonus history available

stock-summary
RIGHTS

No Rights history available

stock-summaryKey Factors

Quality key factors stock-summary

Factor
Value
Sales Growth (5y)
13.83%
EBIT Growth (5y)
34.36%
EBIT to Interest (avg)
6.54
Debt to EBITDA (avg)
1.94
Net Debt to Equity (avg)
-0.39
Sales to Capital Employed (avg)
0.98
Tax Ratio
28.92%
Dividend Payout Ratio
9.97%
Pledged Shares
0
Institutional Holding
0.01%
ROCE (avg)
11.48%
ROE (avg)
7.90%

Valuation key factors

Factor
Value
P/E Ratio
20
Industry P/E
50
Price to Book Value
2.36
EV to EBIT
16.20
EV to EBITDA
12.70
EV to Capital Employed
3.24
EV to Sales
1.80
PEG Ratio
0.68
Dividend Yield
0.40%
ROCE (Latest)
16.81%
ROE (Latest)
11.71%

Technicals key factors

Indicator
Weekly
Monthly
MACD
Bullish
Bullish
RSI
No Signal
No Signal
Bollinger Bands
Bullish
Bullish
Moving Averages
Bullish (Daily)
KST
Bullish
Mildly Bearish
Dow Theory
Mildly Bullish
Mildly Bullish
stock-summary Technical Indicator Scale: Bearish, Mildly Bearish, Sideways, Mildly Bullish, Bullish  Turned 
stock-summaryShareholding
Shareholding Snapshot : Jun 2026stock-summary
Shareholding Compare (%holding) stock-summary
Majority shareholders

Non Institution

Pledged Promoter Holdings

None

Mutual Funds

Held by 1 Schemes (0.01%)

FIIs

Held by 0 FIIs

Promoter with highest holding

Anil Kumar Agarwal (10.89%)

Highest Public shareholder

Kumudha Palaniswamy (7.37%)

Individual Investors Holdings

47.97%

stock-summaryFinancial
[
  {
    "link": "quarterly",
    "btn_text": "All Quarterly Results",
    "header": "Quarterly Results Snapshot (Standalone) - Jun'26 - YoY",
    "rhs": [
      {
        "prefix": "Net Sales ",
        "suffix": "YoY Growth in quarter ended Jun 2026 is 31.83% vs 35.93% in Jun 2025",
        "dir": -1
      },
      {
        "prefix": "Standalone Net Profit ",
        "suffix": "YoY Growth in quarter ended Jun 2026 is 50.38% vs -62.19% in Jun 2025",
        "dir": 1
      }
    ],
    "table": {
      "header": [
        "Jun'26",
        "Jun'25",
        "Change(%)"
      ],
      "body": [
        {
          "field": "Net Sales",
          "val1": "27.13",
          "val2": "20.58",
          "chgp": "31.83%",
          "chgp_class": "positive"
        },
        {
          "field": "Operating Profit (PBDIT) excl Other Income",
          "val1": "5.34",
          "val2": "3.57",
          "chgp": "49.58%",
          "chgp_class": "positive"
        },
        {
          "field": "Interest",
          "val1": "0.30",
          "val2": "0.17",
          "chgp": "76.47%",
          "chgp_class": "negative"
        },
        {
          "field": "Exceptional Items",
          "val1": "0.00",
          "val2": "0.00",
          "chgp": "",
          "chgp_class": "neutral"
        },
        {
          "field": "Standalone Net Profit",
          "val1": "3.94",
          "val2": "2.62",
          "chgp": "50.38%",
          "chgp_class": "positive"
        },
        {
          "field": "Operating Profit Margin (Excl OI)",
          "val1": "19.68%",
          "val2": "17.35%",
          "chgp": "2.33%",
          "chgp_class": "positive"
        }
      ]
    }
  },
  {
    "link": "half-yearly",
    "btn_text": "All Half Yearly Results",
    "header": "Half Yearly Results Snapshot (Standalone) - Sep'25",
    "rhs": [
      {
        "prefix": "Net Sales ",
        "suffix": " Growth in half year ended Sep 2025 is 30.71% vs -11.72% in Sep 2024",
        "dir": 1
      },
      {
        "prefix": "Standalone Net Profit ",
        "suffix": " Growth in half year ended Sep 2025 is -42.60% vs 184.62% in Sep 2024",
        "dir": -1
      }
    ],
    "table": {
      "header": [
        "Sep'25",
        "Sep'24",
        "Change(%)"
      ],
      "body": [
        {
          "field": "Net Sales",
          "val1": "44.22",
          "val2": "33.83",
          "chgp": "30.71%",
          "chgp_class": "positive"
        },
        {
          "field": "Operating Profit (PBDIT) excl Other Income",
          "val1": "6.01",
          "val2": "2.30",
          "chgp": "161.30%",
          "chgp_class": "positive"
        },
        {
          "field": "Interest",
          "val1": "0.29",
          "val2": "0.45",
          "chgp": "-35.56%",
          "chgp_class": "positive"
        },
        {
          "field": "Exceptional Items",
          "val1": "0.00",
          "val2": "6.87",
          "chgp": "-100.00%",
          "chgp_class": "negative"
        },
        {
          "field": "Standalone Net Profit",
          "val1": "4.46",
          "val2": "7.77",
          "chgp": "-42.60%",
          "chgp_class": "negative"
        },
        {
          "field": "Operating Profit Margin (Excl OI)",
          "val1": "13.59%",
          "val2": "6.80%",
          "chgp": "6.79%",
          "chgp_class": "positive"
        }
      ]
    }
  },
  {
    "link": "nine-monthly",
    "btn_text": "All Nine Monthly Results",
    "header": "Nine Monthly Results Snapshot (Standalone) - Dec'25",
    "rhs": [
      {
        "prefix": "Net Sales ",
        "suffix": "YoY Growth in nine months ended Dec 2025 is 24.17% vs -0.44% in Dec 2024",
        "dir": 1
      },
      {
        "prefix": "Standalone Net Profit ",
        "suffix": "YoY Growth in nine months ended Dec 2025 is -16.12% vs 124.17% in Dec 2024",
        "dir": -1
      }
    ],
    "table": {
      "header": [
        "Dec'25",
        "Dec'24",
        "Change(%)"
      ],
      "body": [
        {
          "field": "Net Sales",
          "val1": "67.86",
          "val2": "54.65",
          "chgp": "24.17%",
          "chgp_class": "positive"
        },
        {
          "field": "Operating Profit (PBDIT) excl Other Income",
          "val1": "8.86",
          "val2": "4.43",
          "chgp": "100.00%",
          "chgp_class": "positive"
        },
        {
          "field": "Interest",
          "val1": "0.54",
          "val2": "0.65",
          "chgp": "-16.92%",
          "chgp_class": "positive"
        },
        {
          "field": "Exceptional Items",
          "val1": "0.00",
          "val2": "6.87",
          "chgp": "-100.00%",
          "chgp_class": "negative"
        },
        {
          "field": "Standalone Net Profit",
          "val1": "7.39",
          "val2": "8.81",
          "chgp": "-16.12%",
          "chgp_class": "negative"
        },
        {
          "field": "Operating Profit Margin (Excl OI)",
          "val1": "13.06%",
          "val2": "8.11%",
          "chgp": "4.95%",
          "chgp_class": "positive"
        }
      ]
    }
  },
  {
    "link": "annual",
    "btn_text": "All Annual Results",
    "header": "Annual Results Snapshot (Standalone) - Mar'26",
    "rhs": [
      {
        "prefix": "Net Sales ",
        "suffix": "YoY Growth in year ended Mar 2026 is 16.98% vs 2.09% in Mar 2025",
        "dir": 1
      },
      {
        "prefix": "Standalone Net Profit ",
        "suffix": "YoY Growth in year ended Mar 2026 is -60.90% vs 298.97% in Mar 2025",
        "dir": -1
      }
    ],
    "table": {
      "header": [
        "Mar'26",
        "Mar'25",
        "Change(%)"
      ],
      "body": [
        {
          "field": "Net Sales",
          "val1": "91.40",
          "val2": "78.13",
          "chgp": "16.98%",
          "chgp_class": "positive"
        },
        {
          "field": "Operating Profit (PBDIT) excl Other Income",
          "val1": "12.08",
          "val2": "7.87",
          "chgp": "53.49%",
          "chgp_class": "positive"
        },
        {
          "field": "Interest",
          "val1": "0.87",
          "val2": "0.87",
          "chgp": "",
          "chgp_class": "neutral"
        },
        {
          "field": "Exceptional Items",
          "val1": "0.00",
          "val2": "19.22",
          "chgp": "-100.00%",
          "chgp_class": "negative"
        },
        {
          "field": "Standalone Net Profit",
          "val1": "9.11",
          "val2": "23.30",
          "chgp": "-60.90%",
          "chgp_class": "negative"
        },
        {
          "field": "Operating Profit Margin (Excl OI)",
          "val1": "13.22%",
          "val2": "10.07%",
          "chgp": "3.15%",
          "chgp_class": "positive"
        }
      ]
    }
  }
]

Quarterly Results Snapshot (Standalone) - Jun'26 - YoYstock-summary

Jun'26
Jun'25
Change(%)
Net Sales
27.13
20.58
31.83%
Operating Profit (PBDIT) excl Other Income
5.34
3.57
49.58%
Interest
0.30
0.17
76.47%
Exceptional Items
0.00
0.00
Standalone Net Profit
3.94
2.62
50.38%
Operating Profit Margin (Excl OI)
19.68%
17.35%
2.33%
Values in Rs Cr.
Direction Arrows
Net Sales

YoY Growth in quarter ended Jun 2026 is 31.83% vs 35.93% in Jun 2025

Direction Arrows
Standalone Net Profit

YoY Growth in quarter ended Jun 2026 is 50.38% vs -62.19% in Jun 2025

Half Yearly Results Snapshot (Standalone) - Sep'25stock-summary

Sep'25
Sep'24
Change(%)
Net Sales
44.22
33.83
30.71%
Operating Profit (PBDIT) excl Other Income
6.01
2.30
161.30%
Interest
0.29
0.45
-35.56%
Exceptional Items
0.00
6.87
-100.00%
Standalone Net Profit
4.46
7.77
-42.60%
Operating Profit Margin (Excl OI)
13.59%
6.80%
6.79%
Values in Rs Cr.
Direction Arrows
Net Sales

Growth in half year ended Sep 2025 is 30.71% vs -11.72% in Sep 2024

Direction Arrows
Standalone Net Profit

Growth in half year ended Sep 2025 is -42.60% vs 184.62% in Sep 2024

Nine Monthly Results Snapshot (Standalone) - Dec'25stock-summary

Dec'25
Dec'24
Change(%)
Net Sales
67.86
54.65
24.17%
Operating Profit (PBDIT) excl Other Income
8.86
4.43
100.00%
Interest
0.54
0.65
-16.92%
Exceptional Items
0.00
6.87
-100.00%
Standalone Net Profit
7.39
8.81
-16.12%
Operating Profit Margin (Excl OI)
13.06%
8.11%
4.95%
Values in Rs Cr.
Direction Arrows
Net Sales

YoY Growth in nine months ended Dec 2025 is 24.17% vs -0.44% in Dec 2024

Direction Arrows
Standalone Net Profit

YoY Growth in nine months ended Dec 2025 is -16.12% vs 124.17% in Dec 2024

Annual Results Snapshot (Standalone) - Mar'26stock-summary

Mar'26
Mar'25
Change(%)
Net Sales
91.40
78.13
16.98%
Operating Profit (PBDIT) excl Other Income
12.08
7.87
53.49%
Interest
0.87
0.87
Exceptional Items
0.00
19.22
-100.00%
Standalone Net Profit
9.11
23.30
-60.90%
Operating Profit Margin (Excl OI)
13.22%
10.07%
3.15%
Values in Rs Cr.
Direction Arrows
Net Sales

YoY Growth in year ended Mar 2026 is 16.98% vs 2.09% in Mar 2025

Direction Arrows
Standalone Net Profit

YoY Growth in year ended Mar 2026 is -60.90% vs 298.97% in Mar 2025

stock-summaryCompany CV
About National Fittings Ltd stock-summary
stock-summary
National Fittings Ltd
Micro Cap
Iron & Steel Products
National Fittings Limited was initially incorporated as 'Interfit Techno Products Limited' on 21 April, 1993 to manufacture and market SG Iron Grooved and Screwed Pipe Fittings, Stainless Pipe Fittings and Ball Valves for industrial and non-industrial applications. The name of the Company was changed to 'National Fittings Limited' on 27 September, 2013. Plant set up at Kaniyur, Tamilnadu. Phase-I of the project commenced production in Jan.
Company Coordinates stock-summary
Company Details
SF No 112 Madhapur Road, Kaniyur Village Karumathampatt Coimbatore Tamil Nadu : 641659
stock-summary
Tel: 91 99432 93000
stock-summary
admin@naionalfitting.com
Registrar Details
SKDC Consultants Ltd , Kanapathy Towers, 3rd Floor, Ganapathy, Coimbatore