
Compare Natl. Oxygen with Similar Stocks
Dashboard
With a Negative Book Value, the company has a Weak Long Term Fundamental Strength
- Poor long term growth as Net Sales has grown by an annual rate of -10.40% over the last 5 years
- Company's ability to service its debt is weak with a poor EBIT to Interest (avg) ratio of 0.95
The company has declared Negative results for the last 6 consecutive quarters
Risky - Negative EBITDA
Reducing Promoter Confidence
Below par performance in long term as well as near term
Stock DNA
Other Chemical products
INR 30 Cr (Micro Cap)
NA (Loss Making)
23
0.00%
-4.60
102.78%
-4.85
Total Returns (Price + Dividend) 
Latest dividend: 1 per share ex-dividend date: Sep-18-2013
Risk Adjusted Returns v/s
Returns Beta

News
National Oxygen Ltd is Rated Strong Sell
National Oxygen Ltd is rated Strong Sell by MarketsMOJO, with this rating last updated on 11 Aug 2025. However, the analysis and financial metrics discussed here reflect the company’s current position as of 09 July 2026, providing investors with an up-to-date view of the stock’s fundamentals, valuation, financial trend, and technical outlook.
Read full news article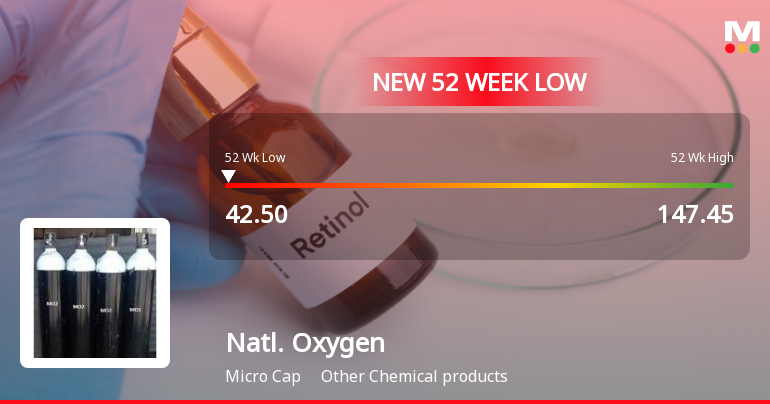
National Oxygen Ltd Falls to 52-Week Low of Rs 42.5 as Sell-Off Deepens
For the seventh consecutive session, National Oxygen Ltd has closed lower, culminating in a fresh 52-week low of Rs 42.5 on 29 Jun 2026. This marks a steep 38.67% decline over the past week, underscoring persistent selling pressure despite a broadly positive market backdrop.
Read full news article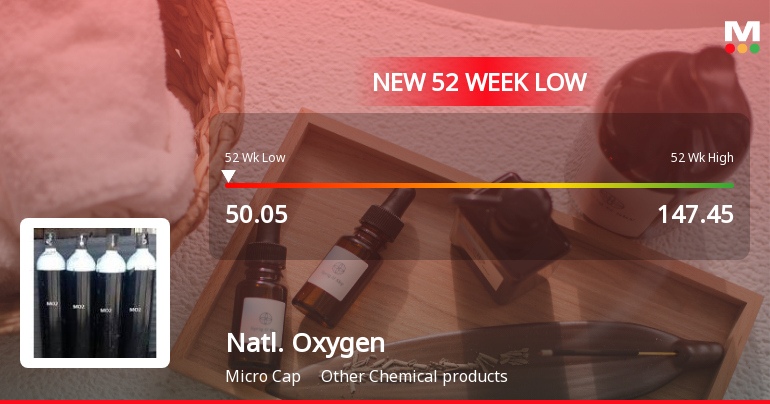
Announcements
Withdrawal Of Preferential Issue
15-Jul-2026 | Source : BSEIntimation regarding withdrawal of Proposed Preferential issue of Equity Shares
Board Meeting Outcome for Held On 15Th July 2026
15-Jul-2026 | Source : BSEWithdrawal of Preferential Issue
Compliances-Certificate under Reg. 74 (5) of SEBI (DP) Regulations 2018
08-Jul-2026 | Source : BSESubmission of Compliance Certificate under Regulation 74(5) of SEBI (DP) Regulations 2018 for the quarter ended 30.06.2026
Corporate Actions

No Upcoming Board Meetings

National Oxygen Ltd has declared 10% dividend, ex-date: 18 Sep 13

No Splits history available

No Bonus history available

National Oxygen Ltd has announced 3:5 rights issue, ex-date: 26 Jun 12
Quality key factors
Valuation key factors
Technicals key factors
 Technical Indicator Scale: Bearish, Mildly Bearish, Sideways, Mildly Bullish, Bullish Turned
 Shareholding Snapshot : Jun 2026
Shareholding Compare (%holding)
Promoters
None
Held by 0 Schemes
Held by 0 FIIs
Rajesh Kumar Saraf (35.02%)
F L Dadabhoy (5.47%)
32.84%
Quarterly Results Snapshot (Standalone) - Mar'26 - QoQ

QoQ Growth in quarter ended Mar 2026 is -21.23% vs -20.88% in Dec 2025

QoQ Growth in quarter ended Mar 2026 is -14.84% vs -122.02% in Dec 2025
Half Yearly Results Snapshot (Standalone) - Sep'25
Growth in half year ended Sep 2025 is -34.09% vs -7.63% in Sep 2024
Growth in half year ended Sep 2025 is 312.76% vs -105.93% in Sep 2024
Nine Monthly Results Snapshot (Standalone) - Dec'25
YoY Growth in nine months ended Dec 2025 is -40.55% vs -6.63% in Dec 2024
YoY Growth in nine months ended Dec 2025 is 182.09% vs -84.52% in Dec 2024
Annual Results Snapshot (Standalone) - Mar'26
YoY Growth in year ended Mar 2026 is -43.42% vs -10.34% in Mar 2025
YoY Growth in year ended Mar 2026 is 126.29% vs -116.72% in Mar 2025
About National Oxygen Ltd

Company Coordinates


