
Compare Natraj Proteins with Similar Stocks
Dashboard
Weak Long Term Fundamental Strength with a -7.11% CAGR growth in Net Sales over the last 5 years
- The company has been able to generate a Return on Equity (avg) of 6.97% signifying low profitability per unit of shareholders funds
Positive results in Mar 26
With ROCE of 1, it has a Very Attractive valuation with a 0.7 Enterprise value to Capital Employed
Majority shareholders : Non Institution
Consistent Underperformance against the benchmark over the last 3 years
Total Returns (Price + Dividend) 
Natraj Proteins for the last several years.
Risk Adjusted Returns v/s
Returns Beta

News
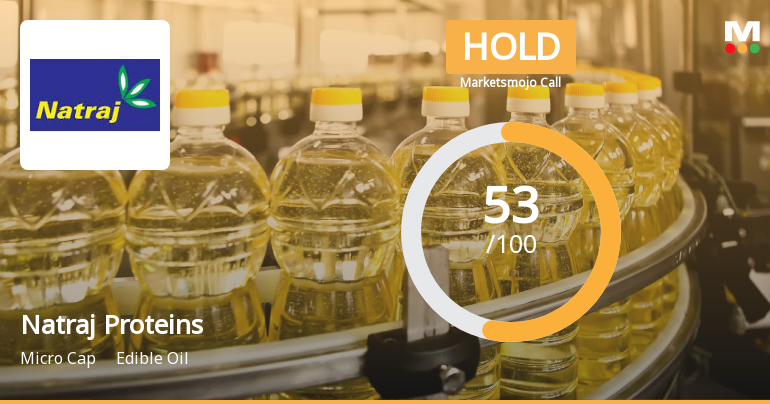
Natraj Proteins Ltd Upgraded to Hold by MarketsMOJO on Technical and Financial Improvements
Natraj Proteins Ltd has seen its investment rating upgraded from Sell to Hold as of 29 May 2026, reflecting a notable improvement in its technical indicators and valuation metrics. Despite a mixed financial trend and ongoing challenges in long-term fundamentals, the stock’s recent performance and market positioning have prompted a reassessment of its outlook within the edible oil sector.
Read full news article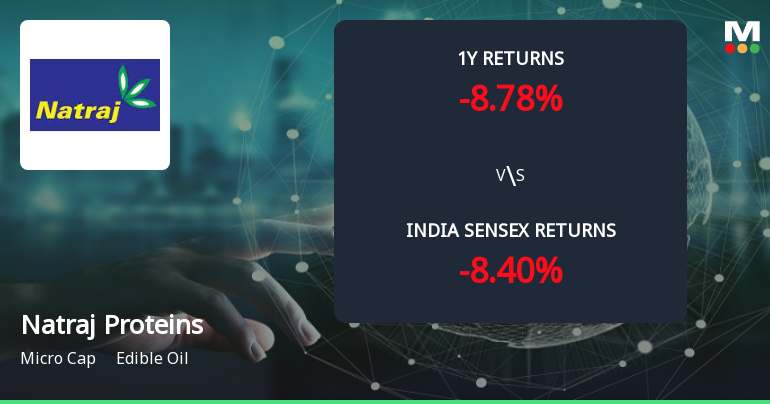
Natraj Proteins Ltd Forms Golden Cross Amid Mixed Technical Signals and Micro-Cap Challenges
The 50-day moving average for Natraj Proteins Ltd has crossed above the 200-day moving average, signalling a golden cross on 29 May 2026. Yet, the stock declined 1.32% on the day the cross formed, and the monthly technical indicators present a mixed picture. This divergence between the moving averages and other signals invites a closer examination of the reliability of this crossover.
Read full news articleAre Natraj Proteins Ltd latest results good or bad?
Natraj Proteins Ltd's latest financial results for Q4 FY26 present a mixed operational picture. The company reported a net profit of ₹1.11 crores, marking a recovery from previous losses in the prior two quarters. This recovery is notable, as it represents a significant improvement compared to the average performance over the last four quarters. However, this positive aspect is overshadowed by a substantial decline in revenue, which fell to ₹18.87 crores, a decrease of 34.41% from the previous quarter. This revenue contraction is the lowest quarterly performance recorded in recent history and raises concerns about the sustainability of the company's profitability. The operating margin for the quarter stood at 9.06%, down from 12.30% in the previous quarter, indicating challenges in maintaining cost efficiencies despite the return to profit. The PAT margin also declined to 5.88%, reflecting a similar trend ...
Read full news article Announcements
Compliances-Reg.24(A)-Annual Secretarial Compliance
25-May-2026 | Source : BSEPursuant to Reg.24A of SEBI Listing Regulations and Master Circular issued by SEBI We are pleased to submit the Annual Secretarial Compliance report for the year ended on 31.03.2026
Announcement under Regulation 30 (LODR)-Newspaper Publication
24-May-2026 | Source : BSESubmission of newspaper advertisement publication related to extract of Quarterly/yearly Audited financial results of the Company for the Quarter and Year ended 31st March 2026
Result For The Year Ended On 31/03/2026
22-May-2026 | Source : BSEWe are pleased to submit the audited financial result for the quarter/year ended on 31.03.2026 alongwith Statement of Assets and Liabilities and Cash Flow.
Corporate Actions

No Upcoming Board Meetings

No Dividend history available

No Splits history available

No Bonus history available

No Rights history available
Quality key factors
Valuation key factors
Technicals key factors
 Technical Indicator Scale: Bearish, Mildly Bearish, Sideways, Mildly Bullish, Bullish Turned
 Shareholding Snapshot : Mar 2026
Shareholding Compare (%holding)
Non Institution
None
Held by 1 Schemes (1.9%)
Held by 0 FIIs
Sharad Kumar Jain (6.38%)
Sangeetha S (5.75%)
50.93%
Quarterly Results Snapshot (Standalone) - Mar'26 - QoQ

QoQ Growth in quarter ended Mar 2026 is -34.41% vs 6.87% in Dec 2025
QoQ Growth in quarter ended Mar 2026 is -61.59% vs 275.15% in Dec 2025
Half Yearly Results Snapshot (Standalone) - Sep'25

Growth in half year ended Sep 2025 is -12.79% vs -68.35% in Sep 2024
Growth in half year ended Sep 2025 is -3.62% vs 77.96% in Sep 2024
Nine Monthly Results Snapshot (Standalone) - Dec'25
YoY Growth in nine months ended Dec 2025 is -13.17% vs -38.83% in Dec 2024
YoY Growth in nine months ended Dec 2025 is 101.10% vs 79.81% in Dec 2024
Annual Results Snapshot (Standalone) - Mar'26
YoY Growth in year ended Mar 2026 is -14.15% vs -39.20% in Mar 2025
YoY Growth in year ended Mar 2026 is 178.08% vs 88.34% in Mar 2025
About Natraj Proteins Ltd

Company Coordinates


