
Compare Naturite Agro with Similar Stocks
Dashboard
With a Operating Losses, the company has a Weak Long Term Fundamental Strength
- Low ability to service debt as the company has a high Debt to EBITDA ratio of 8.89 times
- The company has been able to generate a Return on Equity (avg) of 0.95% signifying low profitability per unit of shareholders funds
With ROCE of 2.4, it has a Expensive valuation with a 6.5 Enterprise value to Capital Employed
Underperformed the market in the last 1 year
Stock DNA
Other Agricultural Products
INR 116 Cr (Micro Cap)
NA (Loss Making)
46
0.00%
0.88
-7.50%
11.94
Total Returns (Price + Dividend) 
Naturite Agro for the last several years.
Risk Adjusted Returns v/s
Returns Beta

News
MarketsMOJO Upgrades Naturite Agro Products Ltd from Strong Sell to Sell on Valuation Improvement
Naturite Agro Products Ltd has seen its investment rating upgraded from Strong Sell to Sell, driven primarily by a marked improvement in valuation metrics and positive financial trends despite ongoing operational challenges. The company’s quality, valuation, financial trend, and technical parameters have been reassessed, reflecting a nuanced outlook for this micro-cap player in the Other Agricultural Products sector.
Read full news article
MarketsMOJO Downgrades Naturite Agro Products Ltd to Strong Sell Amid Valuation Concerns
Naturite Agro Products Ltd has seen its investment rating downgraded from Sell to Strong Sell as of 3 July 2026, driven primarily by a sharp deterioration in valuation metrics and persistent financial weaknesses. Despite some positive quarterly results, the company’s micro-cap status, expensive valuation, and weak fundamentals have raised concerns among analysts, prompting a reassessment of its investment appeal.
Read full news article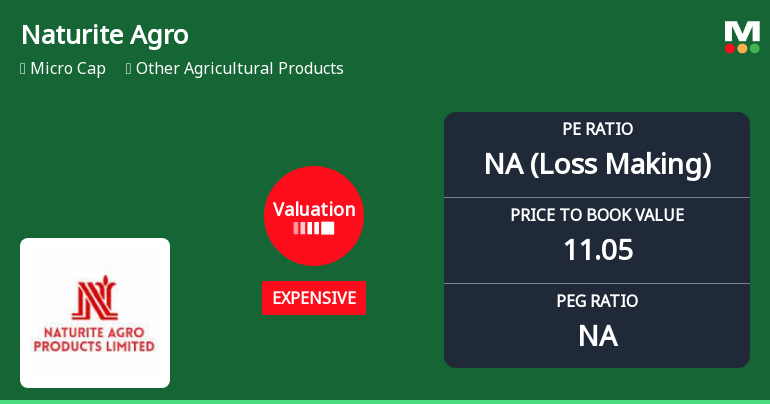
Valuation Shift Raises Concerns for Naturite Agro Products Ltd Amid Mixed Returns
Naturite Agro Products Ltd, a micro-cap player in the Other Agricultural Products sector, has seen a significant shift in its valuation parameters, moving from fair to expensive territory. Despite a recent uptick in share price, the company’s price-to-earnings (P/E) and price-to-book value (P/BV) ratios now stand out sharply against both historical averages and peer benchmarks, raising questions about its price attractiveness for investors.
Read full news article Announcements
Disclosures under Reg. 29(2) of SEBI (SAST) Regulations 2011
16-Jul-2026 | Source : BSEThe Exchange has received the disclosure under Regulation 29(2) of SEBI (Substantial Acquisition of Shares & Takeovers) Regulations 2011 for Y Siva Dharma Teja
Disclosures under Reg. 29(2) of SEBI (SAST) Regulations 2011
15-Jul-2026 | Source : BSEThe Exchange has received the disclosure under Regulation 29(2) of SEBI (Substantial Acquisition of Shares & Takeovers) Regulations 2011 for Y Siva Dharma Teja
Disclosures under Reg. 29(2) of SEBI (SAST) Regulations 2011
06-Jul-2026 | Source : BSEThe Exchange has received the disclosure under Regulation 29(2) of SEBI (Substantial Acquisition of Shares & Takeovers) Regulations 2011 for Y Siva Dharma Teja
Corporate Actions

No Upcoming Board Meetings

No Dividend history available

No Splits history available

No Bonus history available

No Rights history available
Quality key factors
Valuation key factors
Technicals key factors
 Technical Indicator Scale: Bearish, Mildly Bearish, Sideways, Mildly Bullish, Bullish Turned
 Shareholding Snapshot : Mar 2026
Shareholding Compare (%holding)
Promoters
None
Held by 0 Schemes
Held by 0 FIIs
Chandrupatla Sreekanth Reddy (29.82%)
Y Siva Dharma Teja (14.03%)
30.23%
Quarterly Results Snapshot (Standalone) - Mar'26 - QoQ

QoQ Growth in quarter ended Mar 2026 is 27.56% vs -48.81% in Dec 2025

QoQ Growth in quarter ended Mar 2026 is -895.24% vs -70.00% in Dec 2025
Half Yearly Results Snapshot (Standalone) - Sep'24
Growth in half year ended Sep 2024 is -52.33% vs 9.56% in Sep 2023
Growth in half year ended Sep 2024 is 46.44% vs -187.10% in Sep 2023
Nine Monthly Results Snapshot (Standalone) - Dec'24
YoY Growth in nine months ended Dec 2024 is -49.87% vs 18.99% in Dec 2023
YoY Growth in nine months ended Dec 2024 is 28.63% vs -539.02% in Dec 2023
Annual Results Snapshot (Standalone) - Mar'26
YoY Growth in year ended Mar 2026 is 316.36% vs -10.08% in Mar 2025
YoY Growth in year ended Mar 2026 is 70.47% vs -825.71% in Mar 2025
About Naturite Agro Products Ltd

Company Coordinates


