
Compare Naturite Agro with Similar Stocks
Dashboard
With a Operating Losses, the company has a Weak Long Term Fundamental Strength
- Low ability to service debt as the company has a high Debt to EBITDA ratio of 8.89 times
- The company has been able to generate a Return on Equity (avg) of 0.95% signifying low profitability per unit of shareholders funds
Underperformed the market in the last 1 year
Stock DNA
Other Agricultural Products
INR 99 Cr (Micro Cap)
NA (Loss Making)
42
0.00%
0.88
-7.50%
9.86
Total Returns (Price + Dividend) 
Naturite Agro for the last several years.
Risk Adjusted Returns v/s
Returns Beta

News

Naturite Agro Products Ltd is Rated Sell
Naturite Agro Products Ltd is rated 'Sell' by MarketsMOJO. This rating was last updated on 04 June 2026. However, all fundamentals, returns, and financial metrics discussed here reflect the stock's current position as of 04 June 2026, providing investors with an up-to-date analysis of the company’s standing.
Read full news article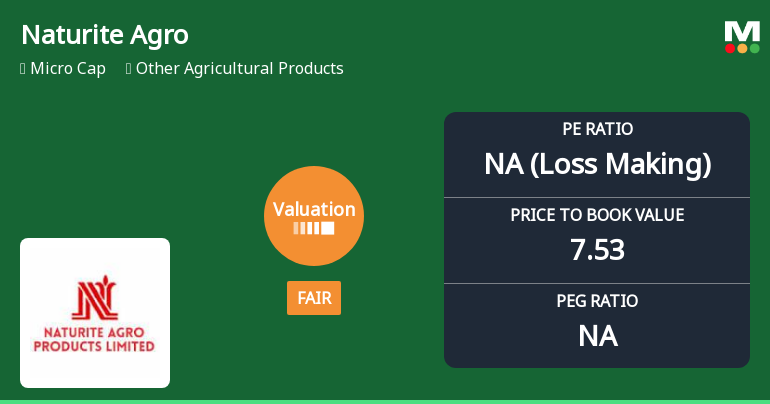
Valuation Shift in Naturite Agro Products Ltd Signals Changing Market Sentiment
Naturite Agro Products Ltd has undergone a notable change in its valuation parameters, shifting from a risky to a fair valuation grade. Despite persistent challenges reflected in its negative returns and profitability metrics, this adjustment signals a potential reappraisal of the stock’s price attractiveness relative to its historical and peer benchmarks.
Read full news article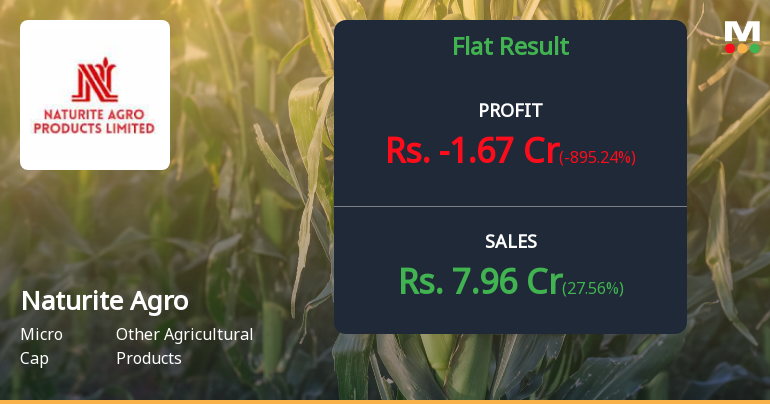
Naturite Agro Products Q4 FY26: Losses Deepen Despite Revenue Surge
Naturite Agro Products Ltd., a micro-cap manufacturer and exporter of capsicum oleoresin and turmeric extracts, reported a challenging fourth quarter for FY26, with net losses widening sharply despite robust revenue growth. The company posted a net loss of ₹1.67 crores in Q4 FY26, representing a dramatic deterioration from a profit of ₹0.21 crores in the previous quarter. The stock, currently trading at ₹157.70 with a market capitalisation of ₹79.00 crores, has declined 0.70% following the results announcement, extending a prolonged downtrend that has seen shares plunge 52.21% over the past year.
Read full news article Announcements
Audited Financial Results For The Quarter Ended March 31 2026
29-May-2026 | Source : BSEAudited Financial Results for the Quarter ended March 31 2026
Board Meeting Intimation for To Consider And Approve The Audited Financial Results For The Year Ended March 31 2026
21-May-2026 | Source : BSENaturite Agro Products Ltdhas informed BSE that the meeting of the Board of Directors of the Company is scheduled on 29/05/2026 inter alia to consider and approve the Audited Financial results for the year ended March 31 2026
Clarification On Price Movement
21-Apr-2026 | Source : BSEAnnouncement under regulation 30 clarification on Price Movement
Corporate Actions

No Upcoming Board Meetings

No Dividend history available

No Splits history available

No Bonus history available

No Rights history available
Quality key factors
Valuation key factors
Technicals key factors
 Technical Indicator Scale: Bearish, Mildly Bearish, Sideways, Mildly Bullish, Bullish Turned
 Shareholding Snapshot : Mar 2026
Shareholding Compare (%holding)
Promoters
None
Held by 0 Schemes
Held by 0 FIIs
Chandrupatla Sreekanth Reddy (29.82%)
Y Siva Dharma Teja (14.03%)
30.23%
Quarterly Results Snapshot (Standalone) - Mar'26 - QoQ

QoQ Growth in quarter ended Mar 2026 is 27.56% vs -48.81% in Dec 2025

QoQ Growth in quarter ended Mar 2026 is -895.24% vs -70.00% in Dec 2025
Half Yearly Results Snapshot (Standalone) - Sep'24
Growth in half year ended Sep 2024 is -52.33% vs 9.56% in Sep 2023
Growth in half year ended Sep 2024 is 46.44% vs -187.10% in Sep 2023
Nine Monthly Results Snapshot (Standalone) - Dec'24
YoY Growth in nine months ended Dec 2024 is -49.87% vs 18.99% in Dec 2023
YoY Growth in nine months ended Dec 2024 is 28.63% vs -539.02% in Dec 2023
Annual Results Snapshot (Standalone) - Mar'26
YoY Growth in year ended Mar 2026 is 316.36% vs -10.08% in Mar 2025
YoY Growth in year ended Mar 2026 is 70.47% vs -825.71% in Mar 2025
About Naturite Agro Products Ltd

Company Coordinates


