
Compare Navkar Urban. with Similar Stocks
Dashboard
Weak Long Term Fundamental Strength with an average Return on Equity (ROE) of 0.86%
- Poor long term growth as Operating profit has grown by an annual rate 16.72% of over the last 5 years
- Company's ability to service its debt is weak with a poor EBIT to Interest (avg) ratio of 1.20
With ROE of 1.8, it has a Very Expensive valuation with a 0.7 Price to Book Value
Underperformed the market in the last 1 year
Total Returns (Price + Dividend) 
Latest dividend: 0 per share ex-dividend date: Sep-23-2025
Risk Adjusted Returns v/s
Returns Beta

News

Navkar Urbanstructure Ltd Locks at Upper Circuit With 4.17% Gain — Buyers Queue, Sellers Absent
At Rs 1.00, the buying was done — not because demand dried up, but because the exchange wouldn't let the stock go any higher. Navkar Urbanstructure Ltd locked at its upper circuit of 4.17% on 13 Jul 2026, with buyers queuing and no sellers willing to part with shares.
Read full news article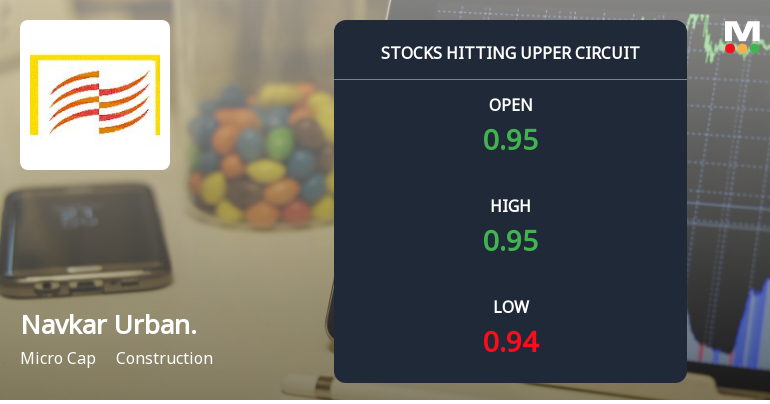
Navkar Urbanstructure Ltd Locks at Upper Circuit With 3.3% Gain — Buyers Queue, Sellers Absent
At Rs 0.96, the buying was done — not because demand dried up, but because the exchange wouldn't let the stock go any higher. Navkar Urbanstructure Ltd locked at its upper circuit of 3.26% on 10 Jul 2026, with buyers queuing and no sellers willing to part with shares.
Read full news article
Navkar Urbanstructure Ltd Locks at Upper Circuit With 3.1% Gain — Buyers Queue, Sellers Absent
At Rs 1.01, the buying was done — not because demand dried up, but because the exchange wouldn't let the stock go any higher. Navkar Urbanstructure Ltd locked at its upper circuit of 3.09% on 7 Jul 2026, with buyers queuing and no sellers willing to part with shares.
Read full news article Announcements
Corporate Actions

No Upcoming Board Meetings


Navkar Urbanstructure Ltd has announced 1:2 stock split, ex-date: 09 May 25

Navkar Urbanstructure Ltd has announced 3:2 bonus issue, ex-date: 24 Apr 25

No Rights history available
Quality key factors
Valuation key factors
Technicals key factors
 Technical Indicator Scale: Bearish, Mildly Bearish, Sideways, Mildly Bullish, Bullish Turned
 Shareholding Snapshot : Mar 2026
Shareholding Compare (%holding)
Non Institution
None
Held by 0 Schemes
Held by 0 FIIs
Navkar Fiscal Services Pvt Ltd (25.28%)
Parimal Jaswantrai Mehta (6.09%)
34.59%
Quarterly Results Snapshot (Standalone) - Mar'26 - QoQ

QoQ Growth in quarter ended Mar 2026 is 171.89% vs 173.20% in Dec 2025
QoQ Growth in quarter ended Mar 2026 is -104.96% vs 1,355.56% in Dec 2025
Half Yearly Results Snapshot (Standalone) - Sep'25

Growth in half year ended Sep 2025 is -8.06% vs -68.86% in Sep 2024
Growth in half year ended Sep 2025 is -79.82% vs 81.30% in Sep 2024
Nine Monthly Results Snapshot (Standalone) - Dec'25
YoY Growth in nine months ended Dec 2025 is -28.86% vs -32.22% in Dec 2024
YoY Growth in nine months ended Dec 2025 is -2.23% vs 50.96% in Dec 2024
Annual Results Snapshot (Standalone) - Mar'26
YoY Growth in year ended Mar 2026 is 45.45% vs -14.21% in Mar 2025
YoY Growth in year ended Mar 2026 is 848.39% vs -69.61% in Mar 2025
About Navkar Urbanstructure Ltd

Company Coordinates


