
Compare NB Footwear with Similar Stocks
Dashboard
With a Negative Book Value, the company has a Weak Long Term Fundamental Strength
- Poor long term growth as Net Sales has grown by an annual rate of % and Operating profit at 0% over the last 5 years
- The company has a negative book value of Rs 1.76 crore
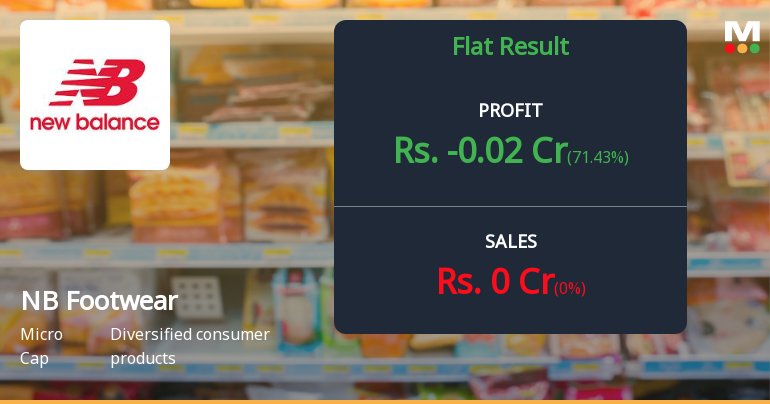
Flat results in Mar 26
Risky - Negative EBITDA
Reducing Promoter Confidence
Underperformed the market in the last 1 year
Stock DNA
Diversified consumer products
INR 9 Cr (Micro Cap)
NA (Loss Making)
37
0.00%
0.00
7.27%
-4.71
Total Returns (Price + Dividend) 
NB Footwear for the last several years.
Risk Adjusted Returns v/s
Returns Beta

News
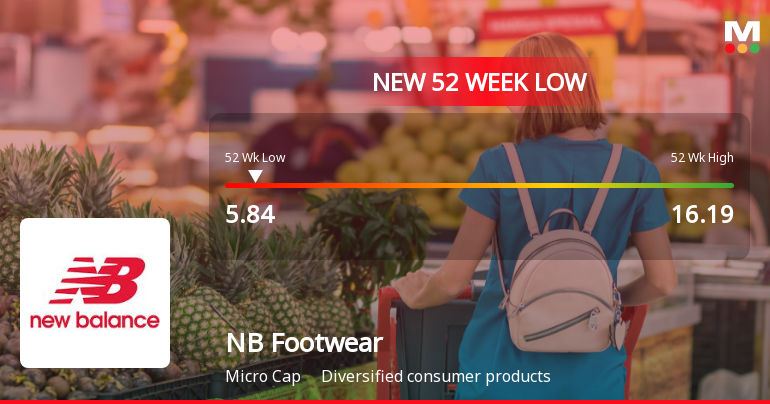
NB Footwear Ltd. Falls to 52-Week Low of Rs 5.84 as Sell-Off Deepens
For the fifth consecutive session, NB Footwear Ltd. closed lower, hitting a fresh 52-week low of Rs 5.84 on 17 Jul 2026. This marks a steep 64% decline from its 52-week high of Rs 16.19, underscoring persistent selling pressure despite a broadly positive market backdrop.
Read full news article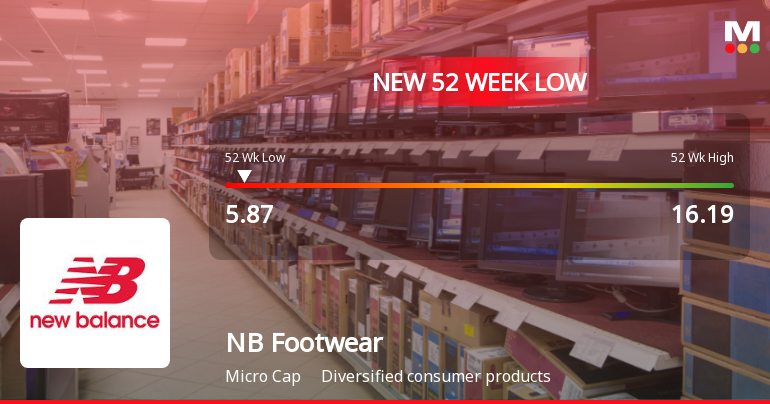
NB Footwear Q4 FY26: Dormant Operations Continue as Losses Mount
NB Footwear Ltd., a micro-cap diversified consumer products company with a market capitalisation of ₹11.00 crores, continues to operate without any revenue generation, posting a net loss of ₹0.02 crores in Q4 FY26. The stock has plummeted 48.67% over the past year, trading at ₹7.70 as of May 29, 2026, reflecting investor concerns about the company's dormant business operations and deteriorating financial position. With negative book value of ₹-1.92 per share and promoter holding declining to 29.63%, the company faces severe structural challenges that question its viability as a going concern.
Read full news article Announcements
Compliances-Certificate under Reg. 74 (5) of SEBI (DP) Regulations 2018
14-Jul-2026 | Source : BSEIntimation of Certificate under Reg 74 (5) of SEBI (DP) Regulations2018
Closure of Trading Window
08-Jul-2026 | Source : BSEIntimation of Closure of Trading Window for quarter ended June 2026
Board Meeting Outcome for Outcome Of Board Meeting Pursuant To Regulation 29 Of SEBI (Listing Obligations And Disclosure Requirements) Regulations 2015.
20-Jun-2026 | Source : BSEShifting of the Registered Office of the Company from Chennai State of Tamil Nadu to Noida State of West Bengal
Corporate Actions

No Upcoming Board Meetings

No Dividend history available

No Splits history available

No Bonus history available

No Rights history available
Quality key factors
Valuation key factors
Technicals key factors
 Technical Indicator Scale: Bearish, Mildly Bearish, Sideways, Mildly Bullish, Bullish Turned
 Shareholding Snapshot : Mar 2026
Shareholding Compare (%holding)
Non Institution
None
Held by 0 Schemes
Held by 0 FIIs
Nitin Krishnalal Minocha (29.63%)
Lemon Management Consultancy Private Limited (4.79%)
54.56%
Quarterly Results Snapshot (Standalone) - Mar'26 - YoY
YoY Growth in quarter ended Mar 2026 is 0.00% vs 0.00% in Mar 2025

YoY Growth in quarter ended Mar 2026 is 71.43% vs -133.33% in Mar 2025
Half Yearly Results Snapshot (Standalone) - Sep'25
Growth in half year ended Sep 2025 is 0.00% vs 0.00% in Sep 2024

Growth in half year ended Sep 2025 is 0.00% vs 8.33% in Sep 2024
Nine Monthly Results Snapshot (Standalone) - Dec'25
YoY Growth in nine months ended Dec 2025 is 0.00% vs 0.00% in Dec 2024
YoY Growth in nine months ended Dec 2025 is 12.50% vs 0.00% in Dec 2024
Annual Results Snapshot (Standalone) - Mar'26
YoY Growth in year ended Mar 2026 is 0.00% vs 0.00% in Mar 2025
YoY Growth in year ended Mar 2026 is 26.09% vs -21.05% in Mar 2025
About NB Footwear Ltd.

Company Coordinates


