
Compare NBI Indl. Fin. with Similar Stocks
Stock DNA
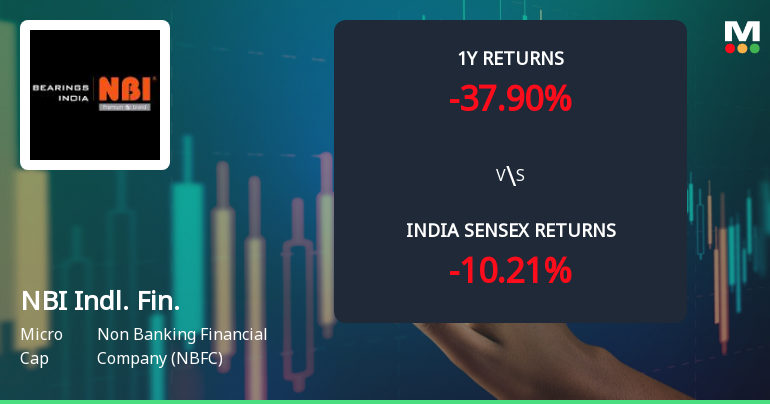
Non Banking Financial Company (NBFC)
INR 535 Cr (Micro Cap)
34.00
20
0.03%
0.00
0.47%
0.20
Total Returns (Price + Dividend) 
Latest dividend: 0.5 per share ex-dividend date: Aug-14-2025
Risk Adjusted Returns v/s
Returns Beta

News
NBI Industrial Finance Company Ltd Faces Bearish Momentum Amid Technical Indicator Shifts
NBI Industrial Finance Company Ltd, a micro-cap player in the Non Banking Financial Company (NBFC) sector, has witnessed a notable shift in its technical momentum, moving from a mildly bearish stance to a more pronounced bearish trend. Despite some mildly bullish signals on weekly indicators, the overall technical landscape remains cautious, reflecting the stock’s challenging performance relative to broader market benchmarks.
Read full news article
NBI Industrial Finance Company Ltd is Rated Sell
NBI Industrial Finance Company Ltd is rated 'Sell' by MarketsMOJO. This rating was last updated on 08 June 2026, reflecting a reassessment of the stock’s outlook. However, all fundamentals, returns, and financial metrics discussed here are current as of 09 June 2026, providing investors with the latest perspective on the company’s position.
Read full news article
NBI Industrial Finance Company Ltd: Technical Momentum Shifts Amid Bearish Sentiment
NBI Industrial Finance Company Ltd, a micro-cap player in the Non Banking Financial Company (NBFC) sector, has experienced a notable shift in its technical momentum, reflecting a complex interplay of bearish and mildly bullish signals. Despite a recent downgrade to a Strong Sell rating with a Mojo Score of 26.0, the stock’s technical indicators reveal nuanced trends that merit close attention from investors navigating a challenging market environment.
Read full news article Announcements
Financial Result Updates
17-Sep-2019 | Source : NSE
| N. B. I. Industrial Finance Company Limited has submitted to the Exchange, the financial results for the period ended June 30, 2019. |
Reasons for Delayed\/Non-submission of Financial Results
03-Sep-2019 | Source : NSE
| N. B. I. Industrial Finance Company Limited has informed the Exchange that NSE mail ref : NSE/LIST/FR/89160IND ?? AS have become applicable to the Company w.e.f. 1st quarter of FY 2019-20. The Company has notified NSE that quarterly results for quarter ended 30th June 2019 would be submitted by 14th September i.e. within one month of the due date in accordance with SEBI Circular No. CIR/CFD/FAC/62/2016 dated July 05, 2016 after approval of our Board. NSE has been notified of deferment of submission of the results vide Notice dated 13.08.2019 filed in NEAPS App. No. 2019/Aug/4404/4562Thanks,Team NBI |
Trading Window
03-Aug-2019 | Source : NSE
| N. B. I. Industrial Finance Company Limited has informed the Exchange regarding the Trading Window closure pursuant to SEBI (Prohibition of Insider Trading) Regulations, 2015 |
Corporate Actions

No Upcoming Board Meetings

NBI Industrial Finance Company Ltd has declared 10% dividend, ex-date: 14 Aug 25

NBI Industrial Finance Company Ltd has announced 5:10 stock split, ex-date: 07 Dec 17

No Bonus history available

No Rights history available
Quality key factors
Valuation key factors
Technicals key factors
 Technical Indicator Scale: Bearish, Mildly Bearish, Sideways, Mildly Bullish, Bullish Turned
 Shareholding Snapshot : Mar 2026
Shareholding Compare (%holding)
Promoters
None
Held by 0 Schemes
Held by 1 FIIs (0.17%)
Shree Capital Services Ltd (21.0%)
Jindal India Power Limited (4.39%)
6.08%
Quarterly Results Snapshot (Standalone) - Mar'26 - YoY

YoY Growth in quarter ended Mar 2026 is -78.09% vs -25.06% in Mar 2025
YoY Growth in quarter ended Mar 2026 is -93.52% vs -28.39% in Mar 2025
Half Yearly Results Snapshot (Standalone) - Sep'25

Growth in half year ended Sep 2025 is 54.55% vs -6.57% in Sep 2024
Growth in half year ended Sep 2025 is 75.85% vs -16.97% in Sep 2024
Nine Monthly Results Snapshot (Standalone) - Dec'25
YoY Growth in nine months ended Dec 2025 is 187.29% vs -13.31% in Dec 2024
YoY Growth in nine months ended Dec 2025 is 240.90% vs -18.12% in Dec 2024
Annual Results Snapshot (Standalone) - Mar'26
YoY Growth in year ended Mar 2026 is 42.57% vs -18.44% in Mar 2025
YoY Growth in year ended Mar 2026 is 46.41% vs -23.17% in Mar 2025
About NBI Industrial Finance Company Ltd

Company Coordinates


