
Compare NCL Industries with Similar Stocks
Dashboard
Strong ability to service debt as the company has a low Debt to EBITDA ratio of 1.28 times
Poor long term growth as Operating profit has grown by an annual rate -11.26% of over the last 5 years
With a growth in Net Profit of 217.07%, the company declared Very Positive results in Mar 26
With ROCE of 11.2, it has a Very Attractive valuation with a 0.9 Enterprise value to Capital Employed
Rising Promoter Confidence
Stock DNA
Cement & Cement Products
INR 826 Cr (Micro Cap)
7.00
33
1.93%
0.24
13.47%
0.87
Total Returns (Price + Dividend) 
Latest dividend: 1.5 per share ex-dividend date: Feb-20-2026
Risk Adjusted Returns v/s
Returns Beta

News
NCL Industries Ltd is Rated Hold by MarketsMOJO
NCL Industries Ltd is rated 'Hold' by MarketsMOJO, with this rating last updated on 29 May 2026. However, the analysis and financial metrics discussed here reflect the company’s current position as of 04 July 2026, providing investors with the latest insights into its performance and outlook.
Read full news article
NCL Industries Ltd is Rated Hold by MarketsMOJO
NCL Industries Ltd is rated 'Hold' by MarketsMOJO, with this rating last updated on 29 May 2026. However, the analysis and financial metrics presented here reflect the stock's current position as of 23 June 2026, providing investors with an up-to-date view of the company’s fundamentals, returns, and market standing.
Read full news article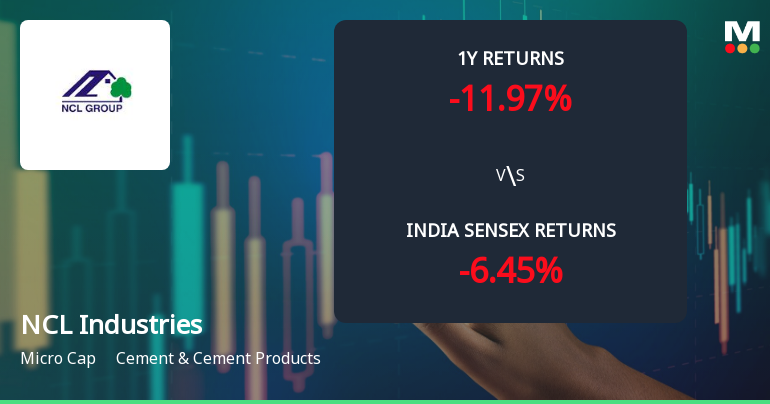
NCL Industries Ltd Technical Momentum Shifts Amid Mixed Market Signals
NCL Industries Ltd, a micro-cap player in the Cement & Cement Products sector, has experienced a notable shift in its technical momentum, moving from a sideways trend to a mildly bearish stance. Despite a recent upgrade in its Mojo Grade from Sell to Hold, the stock’s technical indicators present a complex picture, with mixed signals from MACD, RSI, moving averages, and other momentum oscillators. This analysis delves into the latest technical parameters, price action, and comparative returns to provide investors with a comprehensive view of the stock’s current positioning.
Read full news article Announcements
NCL Industries Limited - Investor Presentation
15-Nov-2019 | Source : NSENCL Industries Limited has informed the Exchange regarding Investor Presentation
NCL Industries Limited - Outcome of Board Meeting
14-Nov-2019 | Source : NSENCL Industries Limited has informed the Exchange regarding Board meeting held on November 14, 2019.
NCL Industries Limited - Updates
09-Oct-2019 | Source : NSENCL Industries Limited has informed the Exchange regarding 'Production and Dispatches details for the Quarter ended 30th September,2019'.
Corporate Actions

No Upcoming Board Meetings

NCL Industries Ltd has declared 15% dividend, ex-date: 20 Feb 26

No Splits history available

No Bonus history available

NCL Industries Ltd has announced 4:5 rights issue, ex-date: 27 Feb 06
Quality key factors
Valuation key factors
Technicals key factors
 Technical Indicator Scale: Bearish, Mildly Bearish, Sideways, Mildly Bullish, Bullish Turned
 Shareholding Snapshot : Mar 2026
Shareholding Compare (%holding)
Non Institution
13.8997
Held by 1 Schemes (0.01%)
Held by 40 FIIs (3.87%)
Ravi Kalidindi (6.84%)
Anand Rathi Global Finance Limited (2.79%)
38.54%
Quarterly Results Snapshot (Consolidated) - Mar'26 - QoQ

QoQ Growth in quarter ended Mar 2026 is 16.65% vs -0.71% in Dec 2025
QoQ Growth in quarter ended Mar 2026 is 217.07% vs -33.47% in Dec 2025
Half Yearly Results Snapshot (Consolidated) - Sep'25
Growth in half year ended Sep 2025 is -0.45% vs -21.21% in Sep 2024
Growth in half year ended Sep 2025 is 162.72% vs -65.64% in Sep 2024
Nine Monthly Results Snapshot (Consolidated) - Dec'25
YoY Growth in nine months ended Dec 2025 is -0.18% vs -25.31% in Dec 2024
YoY Growth in nine months ended Dec 2025 is 192.34% vs -73.61% in Dec 2024
Annual Results Snapshot (Consolidated) - Mar'26
YoY Growth in year ended Mar 2026 is 0.80% vs -14.15% in Mar 2025
YoY Growth in year ended Mar 2026 is 278.53% vs -72.97% in Mar 2025
About NCL Industries Ltd

Company Coordinates


