
Compare NDR Auto Compon. with Similar Stocks
Dashboard
With ROCE of 17.6, it has a Very Expensive valuation with a 4.8 Enterprise value to Capital Employed
- The stock is trading at a premium compared to its peers' average historical valuations
- Over the past year, while the stock has generated a return of -20.87%, its profits have risen by 17.6% ; the PEG ratio of the company is 1.7
Despite the size of the company, domestic mutual funds hold only 0% of the company
Underperformed the market in the last 1 year
Stock DNA
Auto Components & Equipments
INR 1,866 Cr (Small Cap)
30.00
35
0.35%
0.11
17.50%
5.19
Total Returns (Price + Dividend) 
Latest dividend: 2.7 per share ex-dividend date: Jul-03-2025
Risk Adjusted Returns v/s
Returns Beta

News

NDR Auto Components Ltd is Rated Sell
NDR Auto Components Ltd is rated 'Sell' by MarketsMOJO, with this rating last updated on 11 May 2026. However, the analysis and financial metrics discussed here reflect the stock's current position as of 13 June 2026, providing investors with an up-to-date view of the company’s fundamentals, valuation, financial trends, and technical outlook.
Read full news article
NDR Auto Components Ltd Faces Mildly Bearish Technical Shift Amid Mixed Momentum Signals
NDR Auto Components Ltd, a small-cap player in the Auto Components & Equipments sector, has experienced a subtle shift in price momentum, moving from a sideways trend to a mildly bearish stance. Despite some bullish weekly technical indicators, monthly signals suggest caution, reflecting a complex market environment for the stock as it navigates recent volatility and sectoral pressures.
Read full news article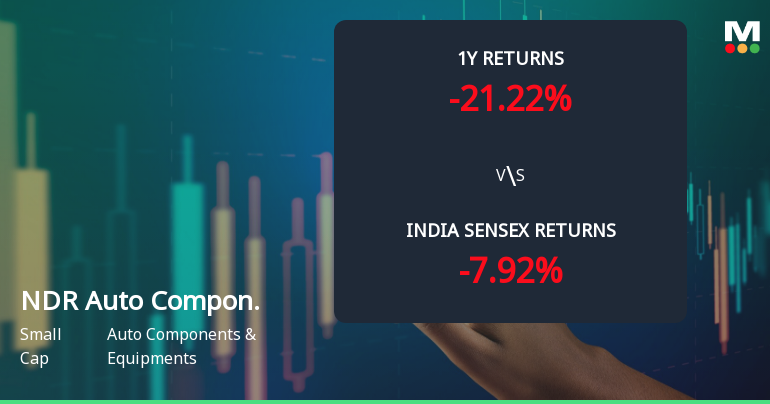
NDR Auto Components Ltd Faces Mildly Bearish Momentum Amid Mixed Technical Signals
NDR Auto Components Ltd, a small-cap player in the Auto Components & Equipments sector, has experienced a shift in price momentum, reflected in a mildly bearish technical trend. Despite some bullish weekly indicators, the overall technical landscape suggests caution for investors as the stock price declined 2.58% today to ₹782.10, retreating from its previous close of ₹802.80.
Read full news article Announcements
Compliances-Reg.24(A)-Annual Secretarial Compliance
28-May-2026 | Source : BSEas per attachment.
Announcement under Regulation 30 (LODR)-Analyst / Investor Meet - Intimation
26-May-2026 | Source : BSEas per attachment
Announcement under Regulation 30 (LODR)-Analyst / Investor Meet - Outcome
26-May-2026 | Source : BSEas per attachment
Corporate Actions

No Upcoming Board Meetings

NDR Auto Components Ltd has declared 40% dividend, ex-date: 20 Jul 26

No Splits history available

NDR Auto Components Ltd has announced 1:1 bonus issue, ex-date: 25 Sep 24

No Rights history available
Quality key factors
Valuation key factors
Technicals key factors
 Technical Indicator Scale: Bearish, Mildly Bearish, Sideways, Mildly Bullish, Bullish Turned
 Shareholding Snapshot : Mar 2026
Shareholding Compare (%holding)
Promoters
None
Held by 0 Schemes
Held by 6 FIIs (0.08%)
Rohit Relan Family Trust (mr. Rohit Relan, Ms. Ritu Relan, Mr. Rishabh Relan, Mr. Pranav Relan And M (73.13%)
None
20.77%
Quarterly Results Snapshot (Consolidated) - Mar'26 - QoQ

QoQ Growth in quarter ended Mar 2026 is 9.98% vs 4.17% in Dec 2025
QoQ Growth in quarter ended Mar 2026 is 21.46% vs 2.29% in Dec 2025
Half Yearly Results Snapshot (Consolidated) - Sep'25

Growth in half year ended Sep 2025 is 11.48% vs 21.13% in Sep 2024
Growth in half year ended Sep 2025 is 21.12% vs 26.51% in Sep 2024
Nine Monthly Results Snapshot (Consolidated) - Dec'25
YoY Growth in nine months ended Dec 2025 is 13.97% vs 22.37% in Dec 2024
YoY Growth in nine months ended Dec 2025 is 18.33% vs 36.05% in Dec 2024
Annual Results Snapshot (Consolidated) - Mar'26
YoY Growth in year ended Mar 2026 is 15.40% vs 18.49% in Mar 2025
YoY Growth in year ended Mar 2026 is 16.30% vs 37.59% in Mar 2025
About NDR Auto Components Ltd

Company Coordinates


