
Compare Neelkanth with Similar Stocks
Dashboard
With a Operating Losses, the company has a Weak Long Term Fundamental Strength
- Poor long term growth as Operating profit has grown by an annual rate 10.53% of over the last 5 years
- Low ability to service debt as the company has a high Debt to EBITDA ratio of 0.39 times
Flat results in Mar 26
Below par performance in long term as well as near term
Total Returns (Price + Dividend) 
Neelkanth for the last several years.
Risk Adjusted Returns v/s
Returns Beta

News
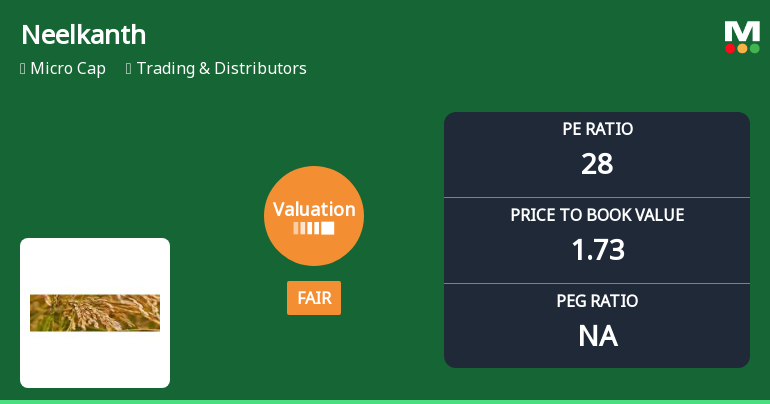
Neelkanth Ltd Valuation Shifts to Fair Amid Market Pressure
Neelkanth Ltd, a micro-cap player in the Trading & Distributors sector, has witnessed a notable shift in its valuation parameters, moving from an expensive to a fair valuation grade. Despite a recent downgrade in its Mojo Grade to a Strong Sell, the company’s price-to-earnings (P/E) and price-to-book value (P/BV) ratios suggest a recalibration of market expectations amid challenging sector dynamics and broader market pressures.
Read full news article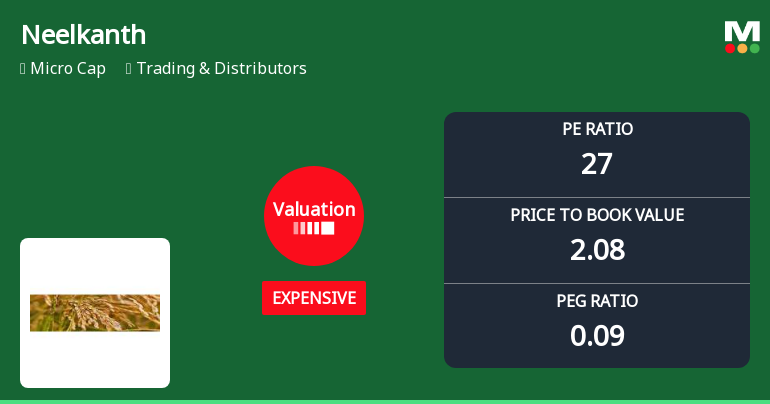
Neelkanth Ltd Valuation Shifts Signal Expensive Terrain Amid Mixed Returns
Neelkanth Ltd, a micro-cap player in the Trading & Distributors sector, has witnessed a notable shift in its valuation parameters, moving from a risky to an expensive classification. Despite a recent surge in share price, the company’s price-to-earnings (P/E) and price-to-book value (P/BV) ratios now stand significantly above peer averages, raising questions about price attractiveness amid mixed financial performance and market returns.
Read full news article
Neelkanth Ltd Valuation Shifts Signal Price Attractiveness Concerns
Neelkanth Ltd, a micro-cap player in the Trading & Distributors sector, has seen its valuation parameters shift notably, raising questions about its price attractiveness. The company’s price-to-earnings (P/E) ratio has moved into an expensive territory at 20.66, while its price-to-book value (P/BV) stands at 1.59, signalling a premium compared to historical averages and peer benchmarks. This article analyses these valuation changes in detail, placing them in the context of Neelkanth’s financial performance, sector dynamics, and relative market positioning.
Read full news article Announcements
Announcement under Regulation 30 (LODR)-Newspaper Publication
30-May-2026 | Source : BSEAs per attachment.
Board Meeting Outcome for Outcome Of The Meeting Of The Board Of Directors Of The Company Held Today I.E. Friday May 29 2026 & Intimation Under Regulation 30 And Regulation 33 Of SEBI (Listing Obligations And Disclosure Requirements) Regulations 2015.
29-May-2026 | Source : BSEwe wish to inform that the Board of Directors of Neelkanth Limited (the Company) has at its meeting held today i.e. Friday May 29 2026 inter alia considered and approved the Audited Financial Results for the quarter and year ended March 31 2026. Pursuant to the provisions of Regulation 33 of the Listing Regulations we enclose the following: a) Audited Financial Results of the Company for the quarter and financial year ended March 31 2026 along with Cash Flow Statement for the financial year ended on that date and Statement of Assets and Liabilities as on that date and Auditors Report on the said Financial Results received from the Statutory Auditors of the Company; b) Declaration of unmodified opinion pursuant to Regulation 33(3)(d) of the Listing Regulations on the Auditors Report on the Audited Financial Results for the financial year ended March 31 2026.
Non-Applicability Of Disclosure Of Related Party Transactions For The Half Year Ended March 31 2026
29-May-2026 | Source : BSEAs per attachment
Corporate Actions

No Upcoming Board Meetings

No Dividend history available

No Splits history available

No Bonus history available

No Rights history available
Quality key factors
Valuation key factors
Technicals key factors
 Technical Indicator Scale: Bearish, Mildly Bearish, Sideways, Mildly Bullish, Bullish Turned
 Shareholding Snapshot : Mar 2026
Shareholding Compare (%holding)
Promoters
None
Held by 3 Schemes (0.02%)
Held by 0 FIIs
Rashmi C Bhimjyani (55.82%)
Gulshan Rai (5.31%)
25.93%
Quarterly Results Snapshot (Standalone) - Mar'26 - YoY

YoY Growth in quarter ended Mar 2026 is -100.00% vs 148.54% in Mar 2025
YoY Growth in quarter ended Mar 2026 is -173.91% vs 109.09% in Mar 2025
Half Yearly Results Snapshot (Standalone) - Sep'24
Growth in half year ended Sep 2024 is -35.32% vs 23.96% in Sep 2023
Growth in half year ended Sep 2024 is -183.33% vs -142.86% in Sep 2023
Nine Monthly Results Snapshot (Standalone) - Dec'24
YoY Growth in nine months ended Dec 2024 is -49.25% vs 47.95% in Dec 2023
YoY Growth in nine months ended Dec 2024 is -215.79% vs -50.00% in Dec 2023
Annual Results Snapshot (Standalone) - Mar'26
YoY Growth in year ended Mar 2026 is -33.60% vs -13.64% in Mar 2025

YoY Growth in year ended Mar 2026 is 2,400.00% vs -96.67% in Mar 2025
About Neelkanth Ltd

Company Coordinates


