
Compare Neueon Corporati with Similar Stocks
Dashboard
With a Operating Losses, the company has a Weak Long Term Fundamental Strength
- Poor long term growth as Net Sales has grown by an annual rate of 7.45% and Operating profit at 6.13% over the last 5 years
- Company's ability to service its debt is weak with a poor EBIT to Interest (avg) ratio of -98.92
Flat results in Mar 26
Risky - Negative EBITDA
Despite the size of the company, domestic mutual funds hold only 0% of the company
Stock DNA
Heavy Electrical Equipment
INR 872 Cr (Micro Cap)
NA (Loss Making)
NA
0.00%
0.18
-115.88%
4.17
Total Returns (Price + Dividend) 
Neueon Corporati for the last several years.
Risk Adjusted Returns v/s
Returns Beta

News
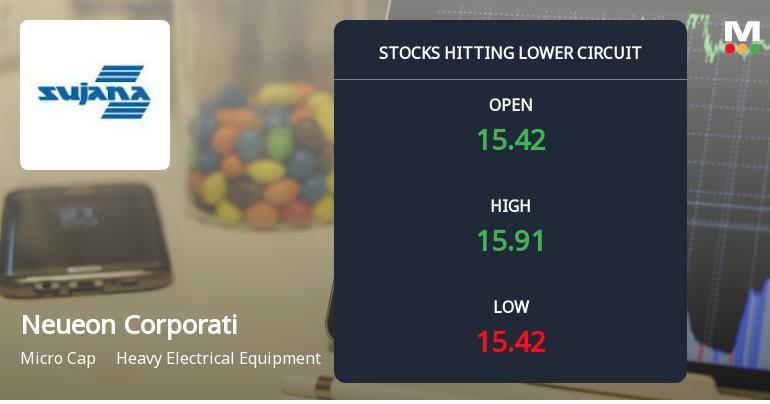
Neueon Corporation Ltd Locks at Lower Circuit With 0.99% Loss — Sellers Queue, No Buyers in Sight
At Rs 15.33, sellers were still queuing — but there were no buyers willing to take the other side. Neueon Corporation Ltd locked at its lower circuit of 5% on 6 Jul 2026, with unfilled sell orders and a frozen price, signalling persistent selling pressure in a micro-cap stock with limited liquidity.
Read full news article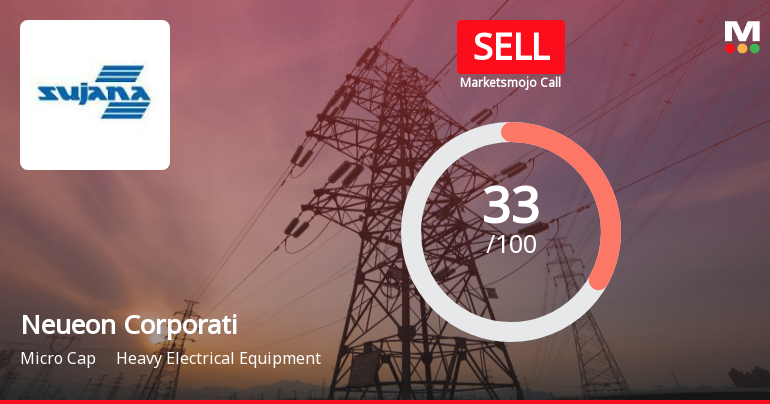
Neueon Corporation Ltd is Rated Sell
Neueon Corporation Ltd is rated 'Sell' by MarketsMOJO, with this rating last updated on 23 December 2025. However, the analysis and financial metrics discussed here reflect the company's current position as of 04 July 2026, providing investors with an up-to-date view of its fundamentals, valuation, financial trends, and technical outlook.
Read full news article
Neueon Corporation Ltd Locks at Lower Circuit With 4.95% Loss — Sellers Queue, No Buyers in Sight
At Rs 16.13, sellers were still queuing — but there were no buyers willing to take the other side. Neueon Corporation Ltd locked at its lower circuit of 4.95% on 3 Jul 2026, with unfilled sell orders and a frozen price.
Read full news article Announcements
Closure of Trading Window
25-Jun-2026 | Source : BSEIntimation of closure of trading window. Letter enclosed.
Intimation Of Approval Of Reclassification Of Erstwhile Promoter(S) Under Approved Resolution Plan By The HonBle NCLT Order Dated 23Rd Oct 2024 And Regulation 31A Of The SEBI (Listing Obligations And Disclosure Requirements) Regulations 2015
25-Jun-2026 | Source : BSEas per attached letter.
Compliances-Reg.24(A)-Annual Secretarial Compliance
26-May-2026 | Source : BSEPlease find enclosed the Annual Secretarial Compliance Report for the year ended 31st March 2026.
Corporate Actions

No Upcoming Board Meetings

No Dividend history available

Neueon Corporation Ltd has announced 10:1 stock split, ex-date: 07 Aug 13

No Bonus history available

No Rights history available
Quality key factors
Valuation key factors
Technicals key factors
 Technical Indicator Scale: Bearish, Mildly Bearish, Sideways, Mildly Bullish, Bullish Turned
 Shareholding Snapshot : Mar 2026
Shareholding Compare (%holding)
Promoters
3.8773
Held by 0 Schemes
Held by 0 FIIs
Preca Structures Private Limited (90.0%)
None
4.49%
Quarterly Results Snapshot (Consolidated) - Mar'26 - QoQ

QoQ Growth in quarter ended Mar 2026 is 405.74% vs -70.39% in Dec 2025

QoQ Growth in quarter ended Mar 2026 is -2,245.34% vs 90.10% in Dec 2025
Half Yearly Results Snapshot (Consolidated) - Sep'25
Growth in half year ended Sep 2025 is 0.00% vs -100.00% in Sep 2024
Growth in half year ended Sep 2025 is -132.73% vs -2.10% in Sep 2024
Nine Monthly Results Snapshot (Consolidated) - Dec'25
YoY Growth in nine months ended Dec 2025 is 97,900.00% vs -66.67% in Dec 2024
YoY Growth in nine months ended Dec 2025 is -64.07% vs -3.77% in Dec 2024
Annual Results Snapshot (Consolidated) - Mar'26
YoY Growth in year ended Mar 2026 is 195.74% vs 5,900.00% in Mar 2025
YoY Growth in year ended Mar 2026 is -259.47% vs 3.16% in Mar 2025
About Neueon Corporation Ltd


