
Key Events This Week
15 Jun: Upper circuit hit with a 16.31% surge to Rs.244.30
16 Jun: Mixed technical signals amid price momentum shift
17-18 Jun: Minor declines and consolidation
19 Jun: Recovery with 4.13% gain to close at Rs.239.35
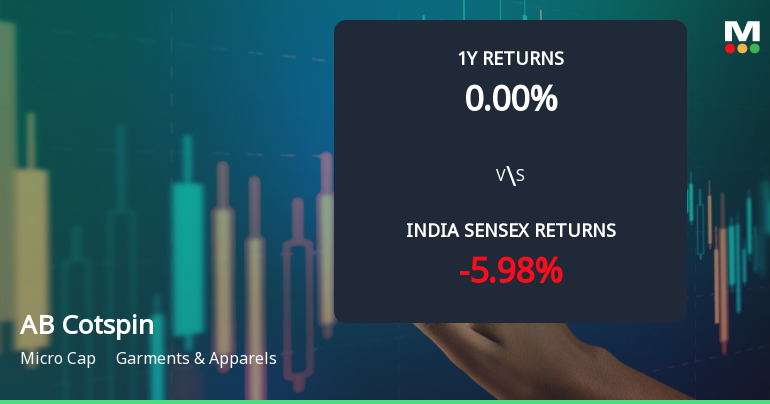
AB Cotspin India Ltd Sees Mixed Technical Signals Amid Price Momentum Shift
2026-06-16 08:07:27AB Cotspin India Ltd, a micro-cap player in the Garments & Apparels sector, has experienced a notable shift in price momentum and technical indicators, reflecting a complex market sentiment. Despite a strong intraday rally of 16.31% on 16 Jun 2026, the stock remains under pressure from longer-term bearish trends, prompting a reassessment of its outlook by analysts and investors alike.
Read full news article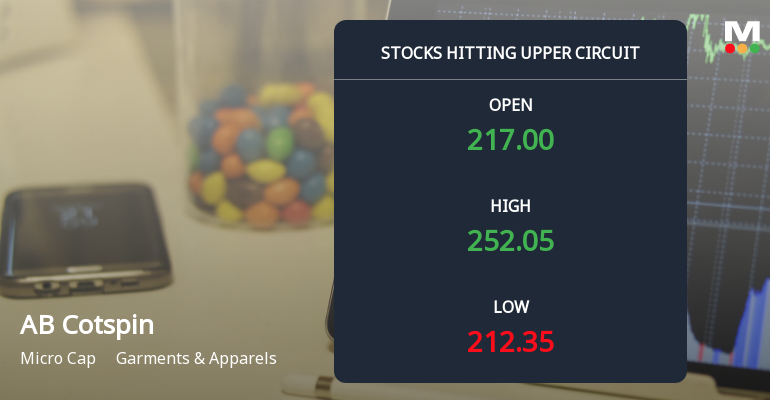
Micro-Cap AB Cotspin India Ltd Locks at Upper Circuit — Rs 17.6 Crore Turnover and Rising Delivery Tell the Story
2026-06-15 15:00:13At Rs 252.21, the buying was done — not because demand dried up, but because the exchange wouldn't let the stock go any higher. AB Cotspin India Ltd locked at its upper circuit of 20% on 15 Jun 2026, with buyers queuing and no sellers willing to part with shares.
Read full news articleAB Cotspin India Ltd Drops 6.21%: Key Financial and Technical Challenges Weigh
2026-06-13 15:14:50
Key Events This Week
1 Jun: Downgrade to Strong Sell announced amid deteriorating quality and valuation concerns
3 Jun: Stock hits 52-week low of Rs.204 amid weak fundamentals
5 Jun: Week closes at Rs.203.80, down 6.21% for the week

AB Cotspin India Ltd is Rated Strong Sell
2026-06-12 10:10:24AB Cotspin India Ltd is rated Strong Sell by MarketsMOJO. This rating was last updated on 29 May 2026, reflecting a significant reassessment of the stock’s outlook. However, all fundamentals, returns, and financial metrics discussed below are current as of 12 June 2026, providing investors with the latest view of the company’s position in the market.
Read full news article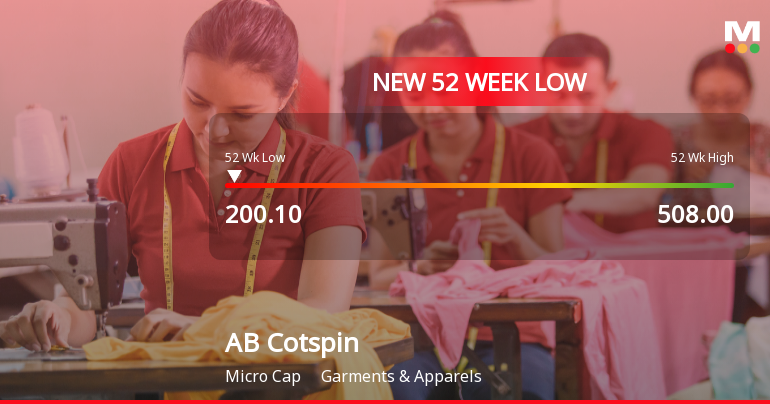
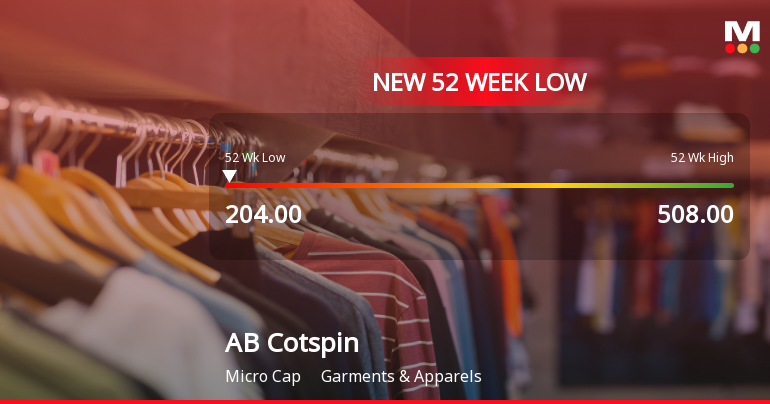
AB Cotspin India Ltd Falls to 52-Week Low of Rs 204 as Sell-Off Deepens
2026-06-03 16:05:30A sharp decline of 6.04% today dragged AB Cotspin India Ltd to a fresh 52-week low of Rs 204, marking a significant drop from its 52-week high of Rs 504. This latest sell-off extends the stock’s downward trajectory amid persistent pressure across multiple fronts.
Read full news article
AB Cotspin India Ltd Downgraded to Strong Sell Amid Weak Fundamentals and Valuation Concerns
2026-06-01 08:27:37AB Cotspin India Ltd, a micro-cap player in the Garments & Apparels sector, has seen its investment rating downgraded from Sell to Strong Sell as of 29 May 2026. This shift reflects deteriorating quality metrics, challenging valuation parameters, a flat financial trend, and a nuanced technical outlook, signalling caution for investors amid a tough operating environment.
Read full news article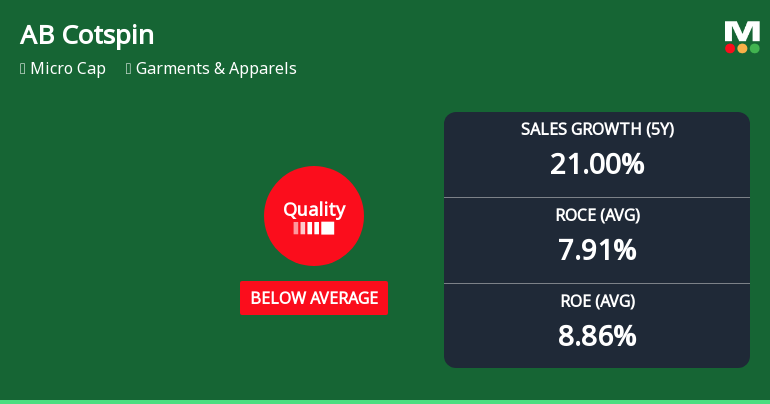
AB Cotspin India Ltd Downgraded to Strong Sell Amid Deteriorating Quality Metrics
2026-06-01 08:01:43AB Cotspin India Ltd, a micro-cap player in the Garments & Apparels sector, has recently seen its quality grade downgraded from average to below average, reflecting a deterioration in key business fundamentals. Despite a modest day gain of 0.58% to ₹217.30 on 1 June 2026, the company’s financial metrics and returns have raised concerns among investors and analysts alike.
Read full news article


