Key Events This Week
1 Jun: Stock opens at Rs.306.90 amid market weakness
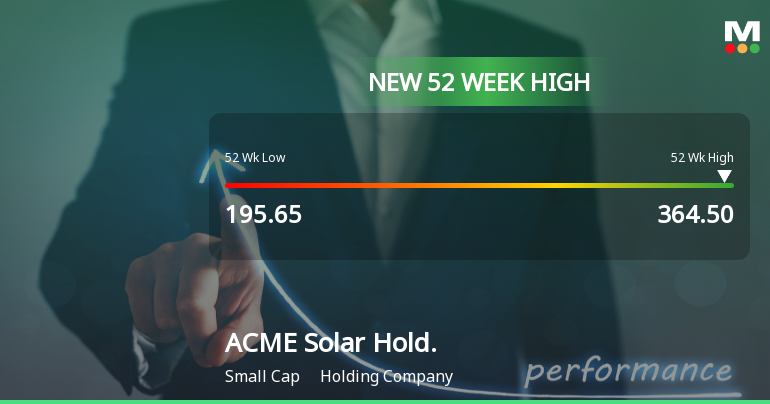
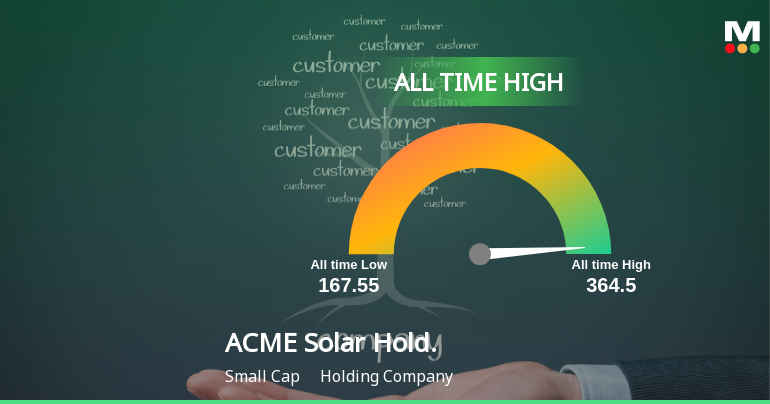
2 Jun: New 52-week and all-time high at Rs.333.5
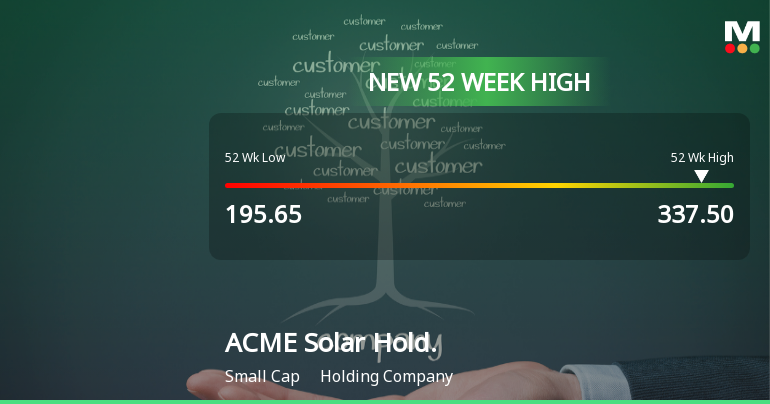
3 Jun: Fresh 52-week high at Rs.337.5 despite intraday volatility
4 Jun: Price rebounds with a 5.29% gain to Rs.346.15
5 Jun: Week closes strong at Rs.356.25 (+2.92%)
Week Open
Rs.306.90
Read full news article