
Is Advance Auto Parts, Inc. technically bullish or bearish?
2025-11-05 11:21:56As of 31 October 2025, the technical trend for Advance Auto Parts, Inc. has changed from mildly bullish to sideways. The current stance is neutral, with mixed signals across various indicators. The weekly MACD and Bollinger Bands are both mildly bearish, while the monthly MACD and KST are mildly bullish. Daily moving averages indicate a mildly bullish trend. There are no clear trends indicated by the Dow Theory or OBV. In terms of performance, the stock has underperformed the S&P 500 over the past week and month, with returns of -14.61% and -21.60% compared to the S&P 500's gains of 0.71% and 1.92%, respectively. However, it has outperformed the benchmark over the past year with a return of 32.66% versus 19.89%. Overall, the technical indicators suggest a cautious approach....
Read MoreIs Advance Auto Parts, Inc. technically bullish or bearish?
2025-11-04 11:33:23As of 31 October 2025, the technical trend for Advance Auto Parts, Inc. has changed from mildly bullish to sideways. The current stance is neutral, with mixed signals across different time frames. The weekly MACD and KST are both mildly bearish, while the monthly MACD and KST are mildly bullish. The Bollinger Bands indicate a bearish trend on both weekly and monthly charts. Daily moving averages show a mildly bullish signal. The RSI shows no signal for both weekly and monthly periods. In terms of performance, the stock has underperformed against the S&P 500 over the past week and month, with returns of -15.82% and -22.71% respectively, while the S&P 500 gained 0.71% and 1.92%. However, the stock has outperformed the S&P 500 over the past year, returning 30.79% compared to the S&P 500's 19.89%....
Read MoreIs Advance Auto Parts, Inc. technically bullish or bearish?
2025-11-03 11:33:05As of 31 October 2025, the technical trend for Advance Auto Parts, Inc. has changed from mildly bullish to sideways. The current technical stance is bearish, primarily driven by the weekly MACD and Bollinger Bands, both indicating bearish momentum. The daily moving averages show a mildly bullish signal, but this is overshadowed by the overall bearish indicators from the weekly timeframe. In terms of performance, the stock has underperformed compared to the S&P 500 across multiple periods, notably with a -75.18% return over the last three years versus a 76.66% return for the index....
Read MoreIs Advance Auto Parts, Inc. technically bullish or bearish?
2025-11-02 11:17:54As of 31 October 2025, the technical trend for Advance Auto Parts, Inc. has changed from mildly bullish to sideways. The current technical stance is bearish, with key indicators such as the weekly MACD and Bollinger Bands both indicating bearish conditions. The daily moving averages show a mildly bullish signal, but this is overshadowed by the overall weekly and monthly bearish indicators, including the KST and OBV. In terms of performance, the stock has underperformed compared to the S&P 500 across multiple periods, notably with a -75.18% return over the past three years versus the S&P 500's 76.66%....
Read More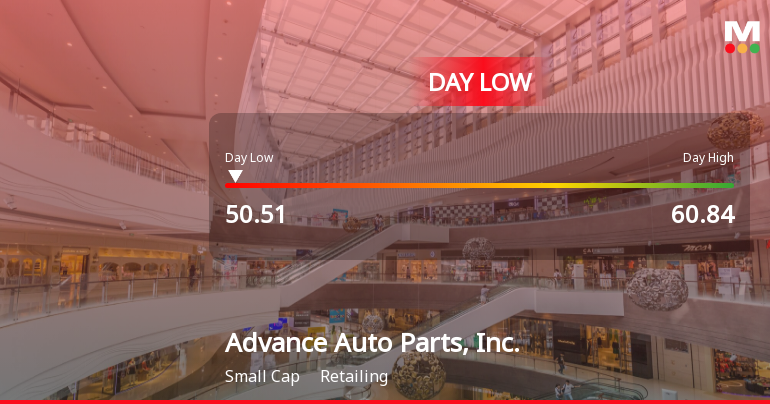
Advance Auto Parts Hits Day Low of $50.51 Amid Price Pressure
2025-10-31 16:56:13Advance Auto Parts, Inc. faced a notable decline in stock performance, with shares hitting an intraday low. The company has seen significant decreases over the past week and month, contrasting with a yearly increase. Financial metrics reveal challenges in profitability, indicating volatility and risks in the current market.
Read More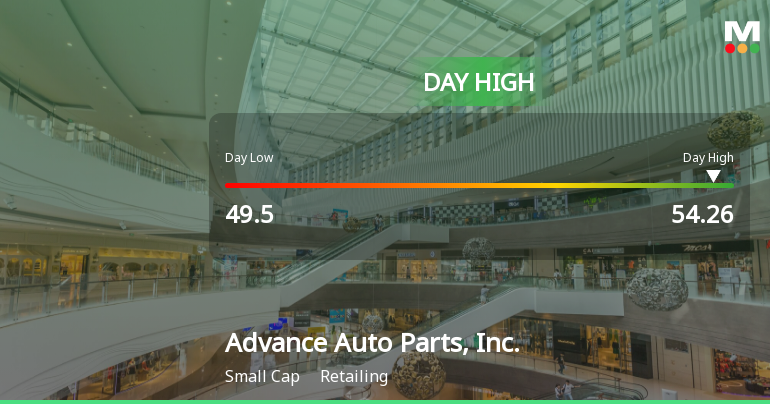
Advance Auto Parts Hits Day High with 9.24% Surge Amid Market Decline
2025-10-14 19:26:59Advance Auto Parts, Inc. saw a notable increase in stock performance on October 13, 2025, reaching an intraday high. Despite recent declines over the week and month, the company has shown strong annual growth. It currently has a market capitalization of USD 3,659 million and faces some financial challenges.
Read More
Advance Auto Parts Hits Day Low of $52.01 Amid Price Pressure
2025-10-09 20:54:39Advance Auto Parts, Inc. faced a challenging trading session on October 8, 2025, with a notable stock decline. Over the past week and month, the stock has significantly underperformed compared to the broader market. Long-term performance metrics reveal substantial declines, raising concerns about the company's financial health.
Read More
Corporate Actions


