Key Events This Week
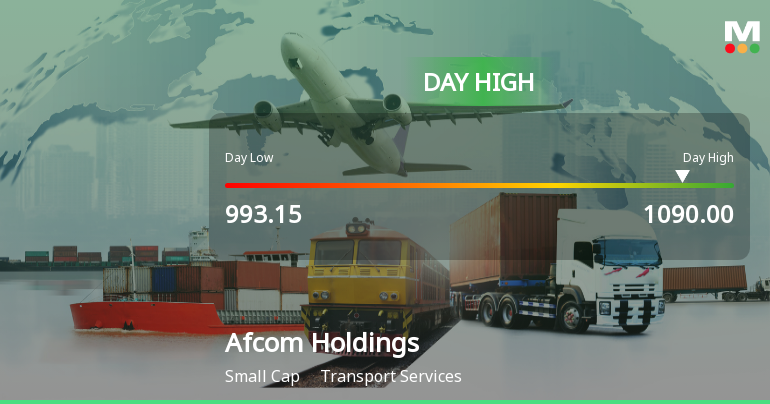
15 Jun: Stock opens strong at Rs.993.15 with 5.03% gain
16 Jun: Intraday high of Rs.1,090 with 8.44% surge
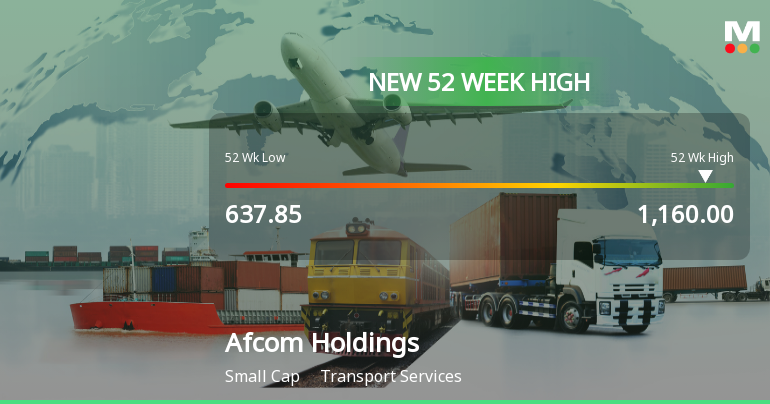
17 Jun: New 52-week high at Rs.1,160
18 Jun: Further 52-week high at Rs.1,175
19 Jun: New 52-week high at Rs.1,207, slight pullback to Rs.1,186.15