
Key Events This Week
15 Jun: Upper circuit hit amid strong buying pressure (Rs.150.05)
15 Jun: Valuation shifts signal renewed price attractiveness
19 Jun: Week closes at Rs.144.60 (-2.69% on day)
Jul 29, 01:14 PM
BSE+NSE Vol: 3200

All E Technologies Ltd is rated Sell by MarketsMOJO. This rating was last updated on 29 May 2026, reflecting a reassessment of the company’s outlook. However, the analysis and financial metrics presented here are based on the stock’s current position as of 25 July 2026, providing investors with the most recent and relevant data to inform their decisions.
Read full news article
All E Technologies Ltd, a micro-cap player in the Computers - Software & Consulting sector, has seen a significant shift in its valuation parameters, moving from an attractive to a very attractive grade. This change comes despite a challenging stock price performance over the past year, highlighting a potential opportunity for value-focused investors amid a mixed industry backdrop.
Read full news article
All E Technologies Ltd is rated 'Sell' by MarketsMOJO, with this rating last updated on 29 May 2026. However, the analysis and financial metrics discussed here reflect the stock's current position as of 14 July 2026, providing investors with the most up-to-date perspective on the company’s performance and outlook.
Read full news article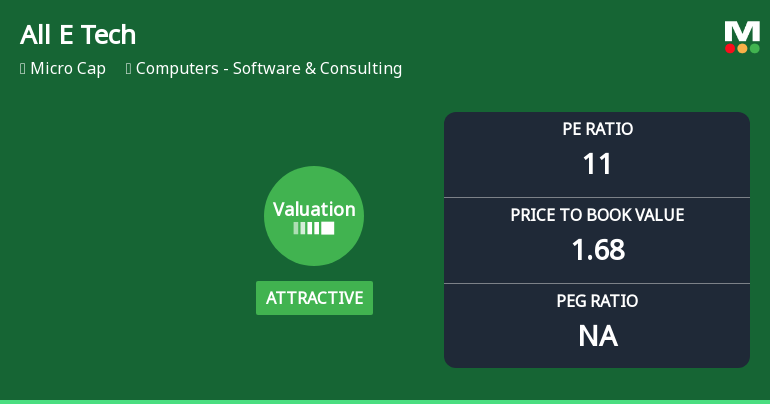
All E Technologies Ltd has experienced a notable shift in its valuation parameters, moving from a very attractive to an attractive rating, reflecting a nuanced change in price attractiveness despite ongoing market headwinds and a challenging return profile relative to benchmarks.
Read full news article
All E Technologies Ltd is rated 'Sell' by MarketsMOJO, with this rating last updated on 29 May 2026. However, the analysis and financial metrics discussed here reflect the stock's current position as of 03 July 2026, providing investors with the latest insights into the company’s performance and outlook.
Read full news article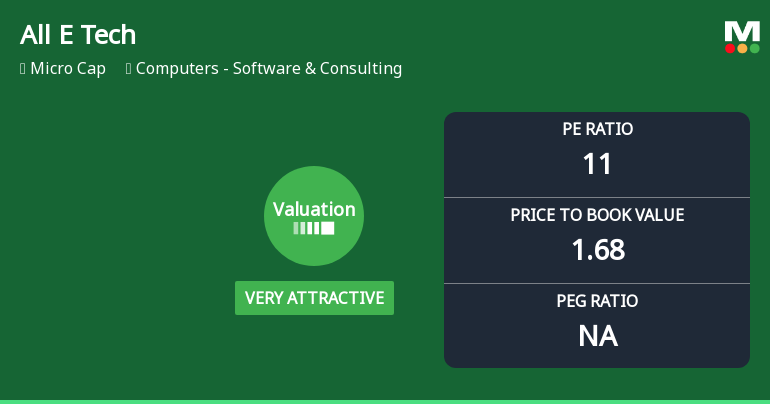
All E Technologies Ltd has seen a marked shift in its valuation parameters, moving from an attractive to a very attractive rating, despite a challenging market environment and significant share price declines over the past year. This article analyses the recent changes in key valuation metrics, compares them with industry peers, and assesses the implications for investors considering the stock within the Computers - Software & Consulting sector.
Read full news article
All E Technologies Ltd is rated 'Sell' by MarketsMOJO, with this rating last updated on 29 May 2026. However, the analysis and financial metrics discussed here reflect the stock's current position as of 22 June 2026, providing investors with an up-to-date view of the company’s performance and outlook.
Read full news article
15 Jun: Upper circuit hit amid strong buying pressure (Rs.150.05)
15 Jun: Valuation shifts signal renewed price attractiveness
19 Jun: Week closes at Rs.144.60 (-2.69% on day)
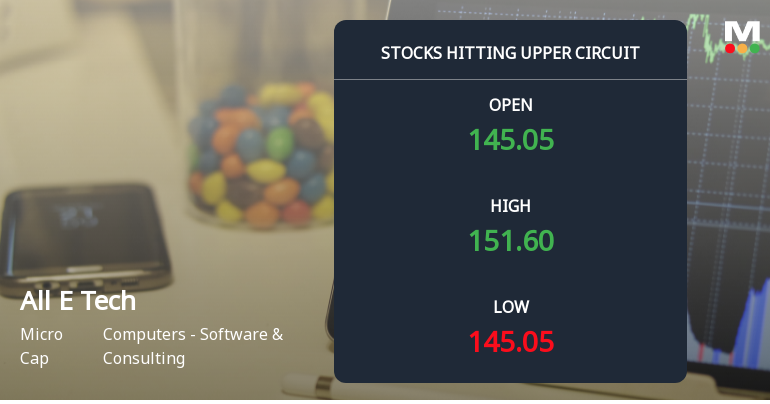
At Rs 151.6, the buying was done — not because demand dried up, but because the exchange wouldn't let the stock go any higher. All E Technologies Ltd locked at its upper circuit of 5.6% on 15 Jun 2026, with buyers queuing and no sellers willing to part with shares.
Read full news article

No Upcoming Board Meetings

All E Technologies Ltd has declared 15% dividend, ex-date: 19 Sep 25

No Splits history available

No Bonus history available

No Rights history available


