
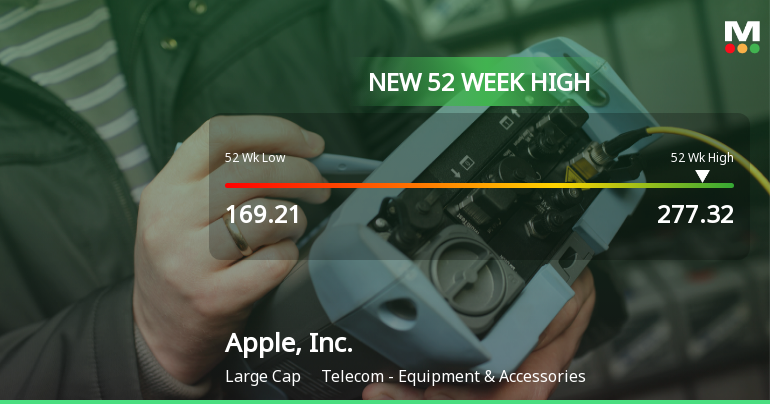
Apple, Inc. Hits New 52-Week High of USD 277.32
2025-11-03 16:56:21Apple, Inc. achieved a new 52-week high of USD 277.32 on October 31, 2025, reflecting its strong performance in the Telecom - Equipment & Accessories industry. With a market capitalization of approximately USD 3.53 trillion, the company showcases impressive financial metrics, including a return on equity of 150.81%.
Read More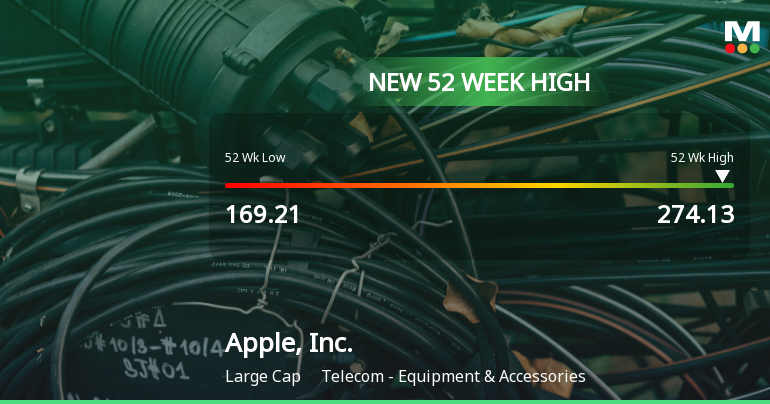
Apple, Inc. Hits New 52-Week High at USD 274.13
2025-10-31 15:51:43Apple, Inc. achieved a new 52-week high of USD 274.13 on October 30, 2025, reflecting its strong market position in the Telecom - Equipment & Accessories industry. The company has shown impressive performance over the past year, with a solid return on equity and financial stability indicators.
Read More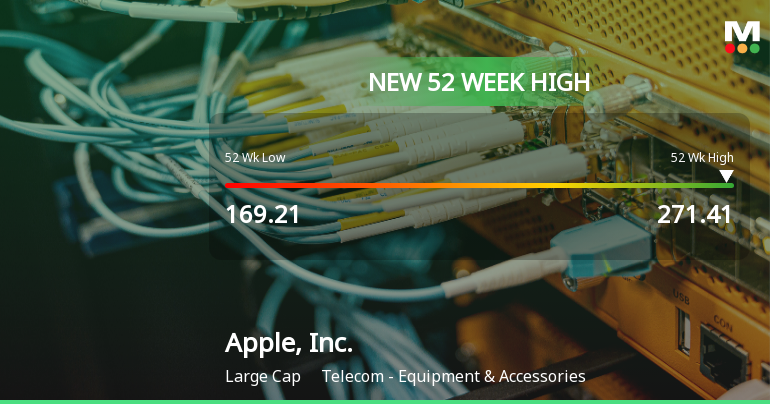
Apple, Inc. Hits New 52-Week High at USD 271.41, Showcasing Strong Performance
2025-10-30 18:04:37Apple, Inc. achieved a new 52-week high of USD 271.41 on October 29, 2025, reflecting its strong market position in the Telecom - Equipment & Accessories industry. The company has shown impressive performance over the past year, with a notable return and solid financial metrics, including a high return on equity.
Read MoreIs Apple, Inc. overvalued or undervalued?
2025-10-21 11:57:56As of 17 October 2025, the valuation grade for Apple, Inc. has moved from very expensive to expensive. The company is currently considered overvalued based on its high valuation ratios, including a P/E ratio of 31, a Price to Book Value of 45.60, and an EV to EBITDA of 22.29. In comparison, Motorola Solutions, Inc. has a P/E of 38.31 and an EV to EBITDA of 26.35, while Garmin Ltd. shows a more attractive P/E of 30.27 and an EV to EBITDA of 23.11. Despite its recent performance, where Apple outperformed the S&P 500 over the past week and month, its year-to-date return of 0.75% significantly lags behind the S&P 500's 13.30%. This underperformance, combined with its elevated valuation metrics, reinforces the conclusion that Apple, Inc. is overvalued in the current market context....
Read More
Apple, Inc. Experiences Valuation Adjustment Amid Competitive Telecom Market Landscape
2025-10-20 15:29:36Apple, Inc. has recently adjusted its valuation, with a current P/E ratio of 31 and a price-to-book value of 45.60. The company demonstrates strong financial metrics, including a ROCE of 109.34% and an ROE of 145.66%, reflecting its competitive position in the telecom equipment sector.
Read MoreIs Apple, Inc. overvalued or undervalued?
2025-10-19 11:53:47As of 17 October 2025, the valuation grade for Apple, Inc. has moved from very expensive to expensive, indicating a slight improvement in its valuation outlook. Despite this change, the company appears to be overvalued based on its current metrics. The P/E ratio stands at 31, which is higher than the peer average of 35.56 for Motorola Solutions, Inc. and 30.27 for Garmin Ltd. Additionally, Apple’s EV to EBITDA ratio of 22.29 and Price to Book Value of 45.60 further support the notion of overvaluation compared to its peers. In terms of performance, Apple has shown strong returns over various periods, with a 5-year return of 111.97%, outperforming the S&P 500's 91.29% during the same timeframe. However, its year-to-date return of 0.75% significantly lags behind the S&P 500's 13.30%, suggesting that while the stock has performed well historically, it may be struggling to maintain momentum in the current marke...
Read More
Apple, Inc. Experiences Revision in Stock Evaluation Amid Market Dynamics
2025-10-14 15:39:18Apple, Inc. has recently revised its evaluation amid changing market conditions. The stock is currently priced at $247.66, reflecting an 8.84% return over the past year, which is lower than the S&P 500's 13.36%. Despite short-term volatility, Apple has demonstrated strong long-term performance, significantly outpacing the index over five years.
Read MoreIs Apple, Inc. technically bullish or bearish?
2025-10-12 11:21:43As of 10 October 2025, the technical trend for Apple, Inc. has changed from mildly bullish to bullish. The weekly MACD is bullish, while the monthly MACD is mildly bearish, indicating mixed signals across time frames. The daily moving averages are bullish, supporting the overall positive stance. The Bollinger Bands and Dow Theory both show mildly bullish signals on a weekly and monthly basis. In terms of returns, Apple has underperformed the S&P 500 year-to-date with a return of -2.06% compared to the S&P 500's 11.41%, but it has outperformed over the 5-year period with a return of 109.69% versus the S&P 500's 88.45%. Overall, the current technical stance is bullish, driven by strong weekly indicators despite some mixed monthly signals....
Read More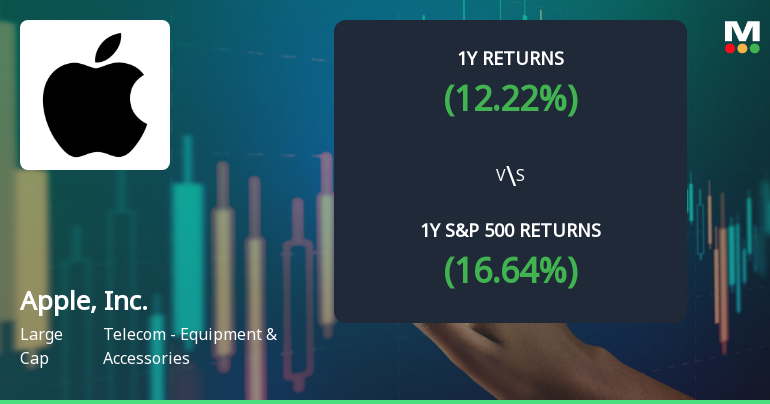
Apple, Inc. Experiences Revision in Its Stock Evaluation Amid Strong Market Performance
2025-09-23 15:49:12Apple, Inc. has recently revised its evaluation amid current market dynamics, with its stock priced at $256.08. The company has experienced significant volatility over the past year, reaching highs of $260.10 and lows of $169.21, while demonstrating strong returns compared to the S&P 500 across various time frames.
Read More
Corporate Actions


