
Is Atlassian Corp. technically bullish or bearish?
2025-11-05 11:24:52As of 31 October 2025, the technical trend for Atlassian Corp. has changed from bearish to mildly bearish. The current stance is mildly bearish, driven by daily moving averages indicating a bearish trend and monthly Bollinger Bands showing a mildly bearish condition. The MACD presents a mixed picture with a mildly bullish signal on the weekly timeframe but bearish on the monthly. The KST and Dow Theory are also mildly bullish on the weekly but bearish on the monthly, reflecting some short-term strength against a longer-term weakness. In terms of performance, Atlassian has underperformed the S&P 500 significantly over multiple periods, with a year-to-date return of -32.20% compared to the S&P 500's 16.30%, and a one-year return of -26.45% versus 19.89% for the index....
Read full news article
Atlassian Corp. Stock Hits Day High with Strong Intraday Performance
2025-11-03 17:49:19Atlassian Corp. saw a significant rise in its stock on October 31, 2025, contrasting with the S&P 500's modest gain. Recent financial results show record operating cash flow and quarterly net sales, though the company faces challenges with declining long-term performance and reduced stakeholder confidence.
Read full news articleIs Atlassian Corp. technically bullish or bearish?
2025-11-02 11:20:20As of 31 October 2025, the technical trend for Atlassian Corp. has changed from bearish to mildly bearish. The current stance is mildly bearish, driven by weekly MACD showing mildly bullish momentum, while monthly MACD remains bearish. The moving averages indicate a mildly bearish trend on the daily timeframe. Additionally, Bollinger Bands and KST are both mildly bearish on weekly and monthly timeframes. The Dow Theory shows no trend on the weekly but is mildly bearish monthly. In terms of performance, Atlassian has underperformed the S&P 500 significantly over longer periods, with a year-to-date return of -30.39% compared to the S&P 500's 16.30%, and a 3-year return of -16.43% against the S&P 500's 76.66%....
Read full news article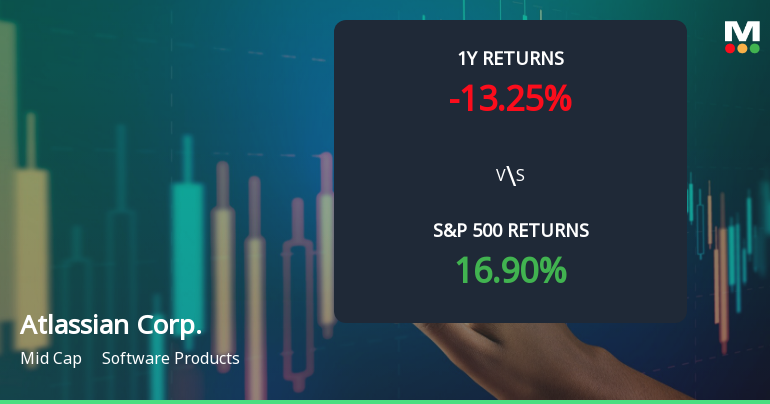
Atlassian Corp. Experiences Revision in Stock Evaluation Amid Market Challenges
2025-10-28 15:51:09Atlassian Corp. has recently revised its evaluation amid challenging market conditions, with its stock price at $164.26. Over the past year, the company has experienced a significant decline, contrasting with the S&P 500's positive performance. Technical indicators show mixed signals, reflecting ongoing market uncertainties.
Read full news articleIs Atlassian Corp. technically bullish or bearish?
2025-10-28 11:46:24As of 24 October 2025, the technical trend for Atlassian Corp. has changed from mildly bearish to bearish. The current stance is bearish with a strong indication from the MACD, which is bearish on both weekly and monthly time frames. The daily moving averages also confirm a bearish outlook. Additionally, the KST is bearish on the weekly and mildly bearish on the monthly, while the Bollinger Bands and OBV are both mildly bearish. The Dow Theory presents a mixed signal with a mildly bullish weekly stance but a mildly bearish monthly view. In terms of performance, Atlassian has underperformed against the S&P 500 across multiple periods, with a year-to-date return of -33.17% compared to the S&P 500's 15.47%, and a 1-year return of -14.11% versus 16.90% for the index....
Read full news articleIs Atlassian Corp. technically bullish or bearish?
2025-10-26 11:32:54As of 24 October 2025, the technical trend for Atlassian Corp. has changed from mildly bearish to bearish. The current stance is bearish with a weak to moderate strength. Key indicators include a bearish MACD across both weekly and monthly time frames, bearish moving averages on the daily chart, and a bearish KST on the weekly. The Bollinger Bands and OBV also indicate a mildly bearish trend. Although Dow Theory shows a mildly bullish signal on the weekly, it is countered by a mildly bearish monthly signal. In terms of performance, Atlassian has underperformed the S&P 500 across multiple periods, with a year-to-date return of -33.17% compared to the S&P 500's 15.47%, and a 1-year return of -14.11% versus 16.90% for the index....
Read full news article
Corporate Actions


