
Is Axcelis Technologies, Inc. overvalued or undervalued?
2025-11-23 11:11:25As of 21 November 2025, Axcelis Technologies, Inc. moved from an attractive to a fair valuation grade. The company appears to be fairly valued based on its current metrics. The P/E ratio stands at 11, which is significantly lower than the peer average of 16.21, while the EV to EBITDA ratio is 7.31, indicating a competitive valuation relative to peers like Graco, Inc. with an EV to EBITDA of 20.31. In comparison to its peers, Axcelis Technologies shows a strong return on capital employed (ROCE) of 41.13% and a return on equity (ROE) of 17.33%, further supporting its fair valuation status. Notably, the stock has underperformed against the S&P 500 over the past year, returning 4.91% compared to the index's 11.00%, and has also lagged over the last three years with a return of -0.36% versus 67.17% for the S&P 500....
Read full news articleIs Axcelis Technologies, Inc. technically bullish or bearish?
2025-11-05 11:21:35As of 31 October 2025, the technical trend for Axcelis Technologies, Inc. has changed from mildly bullish to sideways. The current technical stance is neutral, with mixed signals across different time frames. The weekly MACD is mildly bearish, while the monthly MACD is mildly bullish. The daily moving averages indicate a mildly bullish trend, but the weekly Bollinger Bands are bullish, contrasting with the monthly which is mildly bearish. Additionally, both the weekly and monthly KST are mildly bearish and mildly bullish, respectively. In terms of performance, Axcelis has underperformed the S&P 500 over the past week and month, with returns of -3.29% and -9.24% compared to the S&P 500's 0.71% and 1.92%. However, it has outperformed the benchmark year-to-date with a return of 15.23% versus 16.30%. Over the longer term, the 3-year return of 34.54% is significantly lower than the S&P 500's 76.66%, while the ...
Read full news article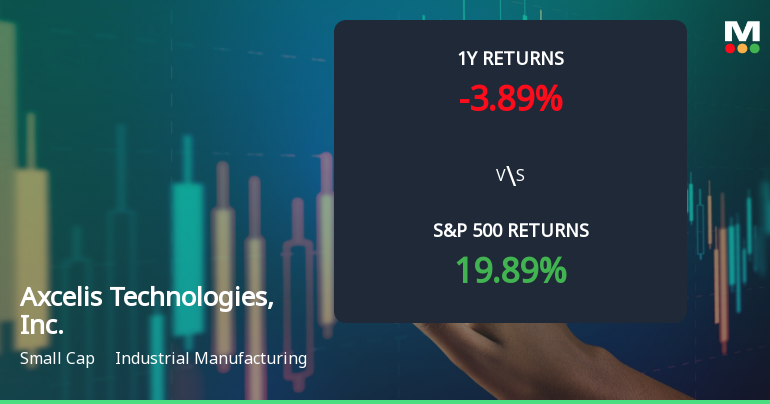
Axcelis Technologies Experiences Revision in Stock Evaluation Amid Market Dynamics
2025-11-04 15:36:01Axcelis Technologies, Inc. has recently revised its evaluation amid changing market conditions. The stock is currently priced at $82.74, reflecting notable volatility over the past year. While year-to-date performance has outpaced the S&P 500, the company has lagged over the past year, showcasing its resilience in a competitive landscape.
Read full news articleIs Axcelis Technologies, Inc. technically bullish or bearish?
2025-11-04 11:33:00As of 31 October 2025, the technical trend for Axcelis Technologies, Inc. has changed from mildly bullish to sideways. The current stance is neutral, with mixed signals across different indicators. The MACD shows a mildly bearish signal on the weekly chart but is mildly bullish on the monthly chart. The Bollinger Bands indicate a bullish stance weekly but mildly bearish monthly. Moving averages are mildly bullish on the daily timeframe. The KST is also mixed, being mildly bearish weekly and mildly bullish monthly. Dow Theory and OBV show no trend in both weekly and monthly perspectives. In terms of performance, Axcelis has underperformed the S&P 500 in the short term, with a 1-week return of -0.61% compared to the S&P's 0.71%, and a 1-month return of -6.73% against the S&P's 1.92%. However, it has outperformed the S&P 500 year-to-date with an 18.42% return versus 16.30%. Over longer periods, Axcelis has si...
Read full news articleIs Axcelis Technologies, Inc. technically bullish or bearish?
2025-11-03 11:32:35As of 31 October 2025, the technical trend for Axcelis Technologies, Inc. has changed from mildly bullish to sideways. The current stance is neutral, with mixed indicators influencing this position. The weekly MACD is mildly bearish, while the monthly MACD is mildly bullish. The daily moving averages indicate a mildly bullish trend, but the Bollinger Bands show a bearish signal on the monthly timeframe. The KST is bearish on both weekly and monthly charts, and the OBV is mildly bearish weekly but mildly bullish monthly. In terms of performance, Axcelis has underperformed against the S&P 500 over the past week and month, with returns of -4.50% and -16.04% compared to 0.71% and 1.92% for the benchmark, respectively. However, it has shown stronger performance over longer periods, with a 5-year return of 260.49% versus the S&P 500's 109.18%....
Read full news articleIs Axcelis Technologies, Inc. technically bullish or bearish?
2025-11-02 11:17:39As of 31 October 2025, the technical trend for Axcelis Technologies, Inc. has changed from mildly bullish to sideways. The current stance is neutral, with mixed indicators influencing the outlook. The weekly MACD is mildly bearish, while the monthly MACD is mildly bullish. The daily moving averages indicate a mildly bullish trend, but the Bollinger Bands and KST show bearish signals on the monthly and weekly time frames, respectively. Additionally, the OBV is mildly bearish weekly but mildly bullish monthly. In terms of performance, Axcelis has underperformed the S&P 500 over the past week and month, with returns of -4.50% and -16.04% compared to the S&P 500's gains of 0.71% and 1.92%. However, it has outperformed the benchmark over the longer term, with a 5-year return of 260.49% versus the S&P 500's 109.18%....
Read full news article
Corporate Actions


