
Key Events This Week
May 25: Stock drops 4.95% to Rs.13.06 amid broad market gains
May 26: Further decline of 4.98% to Rs.12.41 on subdued volume
May 27: Minor fall of 0.89% to Rs.12.30 despite Sensex rise
May 29: Stock rebounds 4.96% to Rs.12.91 following strong quarterly results
Are Balurghat Technologies Ltd latest results good or bad?
2026-05-29 19:38:23Balurghat Technologies Ltd's latest financial results for Q4 FY26 reveal a notable shift in operational performance, characterized by a transition from a net loss in the previous quarter to a net profit of ₹4.61 crores. This marks a significant turnaround, as the company had reported a loss of ₹3.11 crores in Q3 FY26. Additionally, the company's net sales grew to ₹31.81 crores, reflecting a 14.96% sequential increase and a 21.46% year-on-year growth. The operating margin also improved dramatically to 17.04%, the highest level recorded in recent quarters, compared to a negative margin of 9.36% in the prior quarter. Despite these positive quarterly results, the company faces underlying challenges that raise questions about the sustainability of this performance. The previous three quarters had shown losses or minimal profits, indicating a pattern of volatility rather than consistent operational improvement. ...
Read full news article
Balurghat Technologies Ltd Reports Strong Quarterly Turnaround Amid Transport Sector Challenges
2026-05-29 11:01:00Balurghat Technologies Ltd has demonstrated a marked improvement in its financial performance for the quarter ended March 2026, reversing a previously flat trend to a positive trajectory. The transport services company posted robust revenue growth and margin expansion, signalling a potential inflection point despite ongoing sector headwinds.
Read full news article
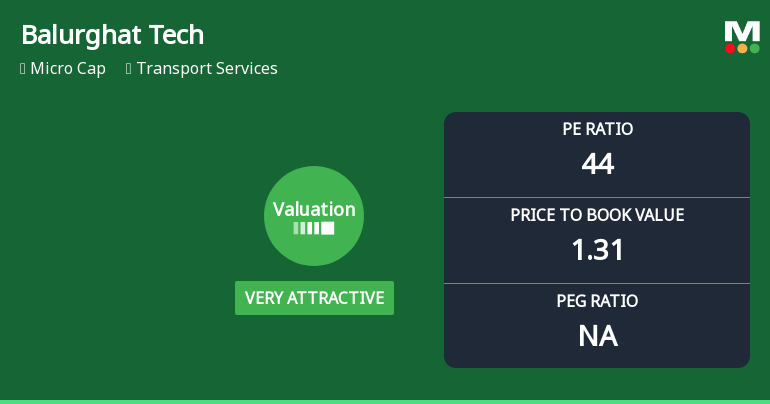
Balurghat Technologies Q4 FY26: Stunning Turnaround Masks Deeper Structural Concerns
2026-05-29 09:35:17Balurghat Technologies Ltd., a micro-cap transport services operator with a market capitalisation of ₹24.00 crores, delivered a remarkable turnaround in Q4 FY26 with net profit surging to ₹4.61 crores from a loss of ₹3.11 crores in the previous quarter. However, the impressive quarterly performance conceals troubling long-term trends, with the stock plunging 35.13% over the past year and trading at ₹12.91, significantly below its 52-week high of ₹22.39.
Read full news article
Balurghat Technologies Ltd is Rated Strong Sell
2026-05-14 10:10:32Balurghat Technologies Ltd is rated Strong Sell by MarketsMOJO, with this rating last updated on 06 Feb 2026. However, the analysis and financial metrics discussed here reflect the stock’s current position as of 14 May 2026, providing investors with the latest insights into the company’s performance and outlook.
Read full news article
Balurghat Technologies Ltd is Rated Strong Sell
2026-04-16 10:10:16Balurghat Technologies Ltd is rated Strong Sell by MarketsMOJO. This rating was last updated on 06 February 2026. However, the analysis and financial metrics discussed below reflect the stock's current position as of 16 April 2026, providing investors with the latest insights into the company’s performance and outlook.
Read full news article


