

Brightcom Group Ltd is Rated Hold by MarketsMOJO
2026-07-27 10:10:04Brightcom Group Ltd is rated 'Hold' by MarketsMOJO, with this rating last updated on 08 June 2026. However, the analysis and financial metrics presented here reflect the stock's current position as of 27 July 2026, providing investors with the most recent insights into the company’s performance and outlook.
Read full news article
Brightcom Group Ltd is Rated Hold by MarketsMOJO
2026-07-16 10:10:04Brightcom Group Ltd is rated 'Hold' by MarketsMOJO, with this rating last updated on 08 June 2026. However, the analysis and financial metrics discussed here reflect the stock's current position as of 16 July 2026, providing investors with the most up-to-date view of the company’s fundamentals and market performance.
Read full news article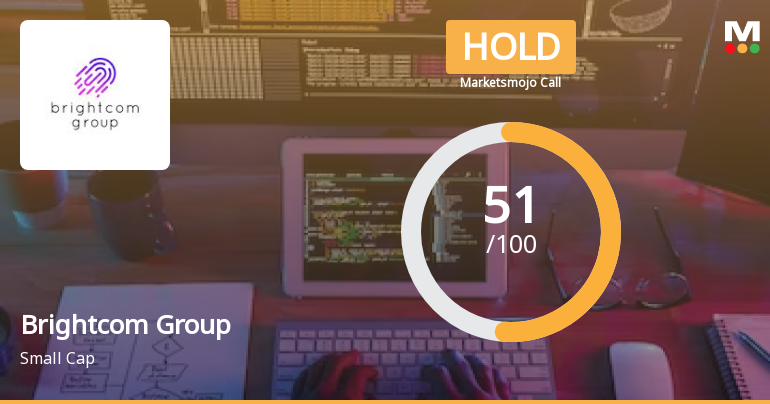
Brightcom Group Ltd is Rated Hold
2026-07-05 10:10:05Brightcom Group Ltd is rated 'Hold' by MarketsMOJO, with this rating last updated on 08 June 2026. However, the analysis and financial metrics discussed here reflect the stock's current position as of 05 July 2026, providing investors with the latest insights into the company’s performance and outlook.
Read full news article
Brightcom Group Ltd Technical Momentum Shifts Amid Bearish Signals
2026-06-29 08:00:53Brightcom Group Ltd has experienced a notable shift in its technical momentum, transitioning from a sideways trend to a mildly bearish stance. Recent technical indicators reveal a complex interplay of bullish and bearish signals, prompting a downgrade in its Mojo Grade from Buy to Hold as of 4 June 2026, reflecting cautious investor sentiment amid price weakness and mixed momentum cues.
Read full news article
Brightcom Group Ltd Technical Momentum Shifts Amid Sideways Trend
2026-06-25 08:01:24Brightcom Group Ltd has experienced a notable shift in its technical momentum, moving from a mildly bullish stance to a more sideways trend, reflecting a period of consolidation after recent volatility. Despite a modest decline in price, key technical indicators present a mixed picture, signalling caution for investors amid evolving market dynamics.
Read full news article
Brightcom Group Ltd is Rated Hold
2026-06-24 10:11:01Brightcom Group Ltd is rated 'Hold' by MarketsMOJO, with this rating last updated on 8 June 2026. While the rating change occurred on that date, the analysis and financial metrics discussed here reflect the stock's current position as of 24 June 2026, providing investors with the latest insights into the company’s performance and outlook.
Read full news article
Brightcom Group Ltd Technical Momentum Shifts to Mildly Bullish Amid Mixed Signals
2026-06-23 08:02:41Brightcom Group Ltd has experienced a subtle yet notable shift in its technical momentum, moving from a sideways trend to a mildly bullish stance. Despite a modest day gain of 0.48%, the stock’s technical indicators present a complex picture, with mixed signals across weekly and monthly timeframes. Investors and analysts are closely monitoring these developments as the company’s mojo grade was recently downgraded from Buy to Hold, reflecting a cautious outlook amid evolving market dynamics.
Read full news article
Brightcom Group Ltd Technical Momentum Shifts Amid Mixed Market Signals
2026-06-17 08:02:02Brightcom Group Ltd has experienced a notable shift in its technical momentum, moving from a mildly bullish stance to a sideways trend, reflecting a complex interplay of technical indicators. Despite a recent downgrade in its Mojo Grade from Buy to Hold, the stock’s mixed signals across MACD, RSI, moving averages, and other momentum indicators suggest cautious investor sentiment amid volatile price action.
Read full news article
Brightcom Group Ltd Sees Technical Momentum Shift Amid Mixed Market Returns
2026-06-15 08:01:47Brightcom Group Ltd has experienced a notable shift in its technical momentum, moving from a sideways trend to a mildly bullish stance, despite mixed signals from key indicators. The stock’s recent 6.64% surge to ₹10.92 reflects renewed investor interest, yet technical metrics present a nuanced picture that warrants close analysis for discerning investors.
Read full news articleCompliances-Certificate under Reg. 74 (5) of SEBI (DP) Regulations 2018
22-Jul-2026 | Source : BSEPursuant Regulation 74 (5) of the SEBI Depositories and Regulations
Financial Results For March 31 2026
22-Jul-2026 | Source : BSEFinancial Results for March 31 2026
Announcement under Regulation 30 (LODR)-Investor Presentation
19-Jun-2026 | Source : BSEInvestor presentation
Corporate Actions

No Upcoming Board Meetings

Brightcom Group Ltd has declared 15% dividend, ex-date: 22 Sep 22

No Splits history available

Brightcom Group Ltd has announced 2:3 bonus issue, ex-date: 15 Mar 22

No Rights history available


