

Key Events This Week
23 Feb: Intraday surge to day high with 8.68% rally and exceptional volume spike
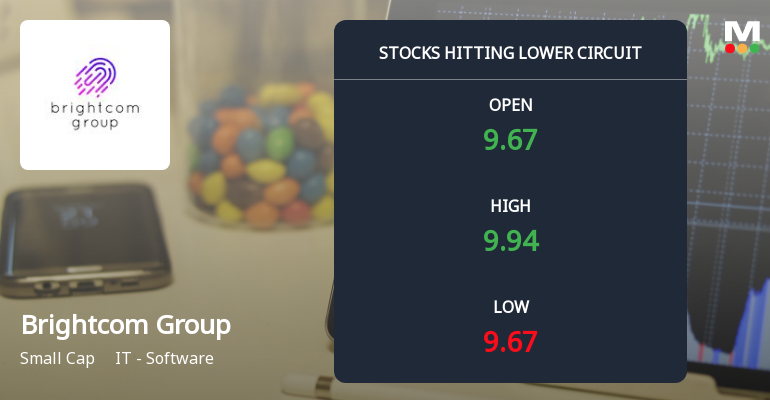
24 Feb: Plunged to lower circuit amid heavy selling pressure
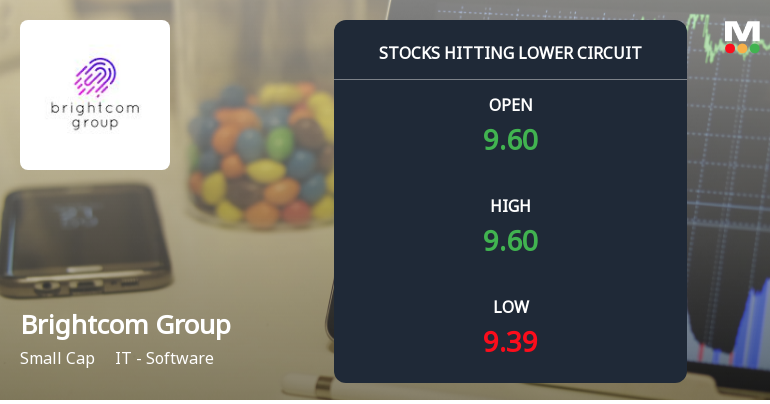
25 Feb: Hit lower circuit again despite positive sector and Sensex performance
26 Feb: Surged to upper circuit on robust buying momentum
27 Feb: Closed lower at Rs.10.70, down 2.64%

Brightcom Group Ltd Surges to Upper Circuit Amid Robust Buying Pressure
2026-02-26 11:00:07Brightcom Group Ltd witnessed a remarkable surge on 26 Feb 2026, hitting its upper circuit limit amid strong buying momentum. The stock outperformed its sector and broader market indices, reflecting renewed investor confidence and significant demand that remains largely unfilled due to regulatory trading restrictions.
Read full news article
Brightcom Group Ltd is Rated Hold
2026-02-26 10:10:03Brightcom Group Ltd is rated 'Hold' by MarketsMOJO, with this rating last updated on 14 February 2026. However, the analysis and financial metrics presented here reflect the stock's current position as of 26 February 2026, providing investors with the latest insights into the company’s performance and outlook.
Read full news article
Brightcom Group Ltd Hits Lower Circuit Amid Heavy Selling Pressure
2026-02-25 10:00:17Brightcom Group Ltd (stock code 405845) witnessed intense selling pressure on 25 Feb 2026, hitting its lower circuit limit and closing at ₹10.49, down 4.64% on the day. The stock’s sharp decline reflects mounting investor concerns amid a broader sector rally, with unfilled supply and panic selling driving the maximum permissible daily loss.
Read full news article
Brightcom Group Ltd Plunges to Lower Circuit Amid Heavy Selling Pressure
2026-02-24 11:00:09Shares of Brightcom Group Ltd plunged to their lower circuit limit on 24 Feb 2026, succumbing to intense selling pressure that saw the stock lose 4.41% in a single session. The sharp decline reflects mounting investor concerns and a wave of panic selling, with the stock closing at ₹11.06 after hitting a low of ₹11.00, marking its maximum daily loss in recent times.
Read full news article


