
Is Bristol Myers Squibb Co. technically bullish or bearish?
2025-11-05 11:17:53As of 31 October 2025, the technical trend for Bristol Myers Squibb Co. has changed from bearish to mildly bearish. The weekly MACD indicates a mildly bullish stance, while the monthly MACD remains bearish. The daily moving averages are mildly bearish, and the KST is bearish on both weekly and monthly time frames. The Bollinger Bands show a sideways trend weekly and bearish monthly. Dow Theory suggests a mildly bullish outlook on the weekly basis, but no trend on the monthly. In terms of performance, Bristol Myers Squibb has underperformed the S&P 500 across multiple periods, with a year-to-date return of -19.40% compared to the S&P 500's 16.30%, and a one-year return of -16.07% versus 19.89%. Overall, the current technical stance is mildly bearish, with mixed signals across different indicators....
Read full news articleIs Bristol Myers Squibb Co. technically bullish or bearish?
2025-11-04 11:29:09As of 31 October 2025, the technical trend for Bristol Myers Squibb Co. has changed from bearish to mildly bearish. The weekly MACD indicates a mildly bullish stance, while the monthly MACD is bearish. The daily moving averages are also mildly bearish, and the KST shows bearish signals on both weekly and monthly time frames. The Bollinger Bands are sideways weekly and mildly bearish monthly, and the Dow Theory indicates no trend weekly but mildly bearish monthly. Overall, the technical stance is mildly bearish with weak momentum. In terms of performance, Bristol Myers Squibb has underperformed the S&P 500 across multiple periods, with a year-to-date return of -18.64% compared to the S&P 500's 16.30%, and a 1-year return of -15.28% versus 19.89% for the index....
Read full news articleIs Bristol Myers Squibb Co. technically bullish or bearish?
2025-11-03 11:28:03As of 31 October 2025, the technical trend for Bristol Myers Squibb Co. has changed from bearish to mildly bearish. The current stance is mildly bearish, driven by the daily moving averages and the overall bearish signals from the KST and Bollinger Bands on the monthly timeframe. The MACD indicates a mildly bullish trend on the weekly basis but remains bearish monthly, which adds to the mixed signals. The stock has underperformed compared to the S&P 500 across multiple periods, with a year-to-date return of -18.55% versus the S&P 500's 16.30%....
Read full news articleIs Bristol Myers Squibb Co. technically bullish or bearish?
2025-11-02 11:14:41As of 31 October 2025, the technical trend for Bristol Myers Squibb Co. has changed from bearish to mildly bearish. The current stance is mildly bearish, driven by the daily moving averages and the KST, which are both bearish. The MACD shows a mildly bullish signal on the weekly timeframe but remains bearish monthly, indicating mixed signals across different periods. The Bollinger Bands and Dow Theory also reflect a mildly bearish outlook on the monthly timeframe. In terms of performance, the stock has underperformed compared to the S&P 500 across multiple periods, with a year-to-date return of -18.55% versus the S&P 500's 16.30%, and a 3-year return of -40.53% compared to the S&P 500's 76.66%....
Read full news article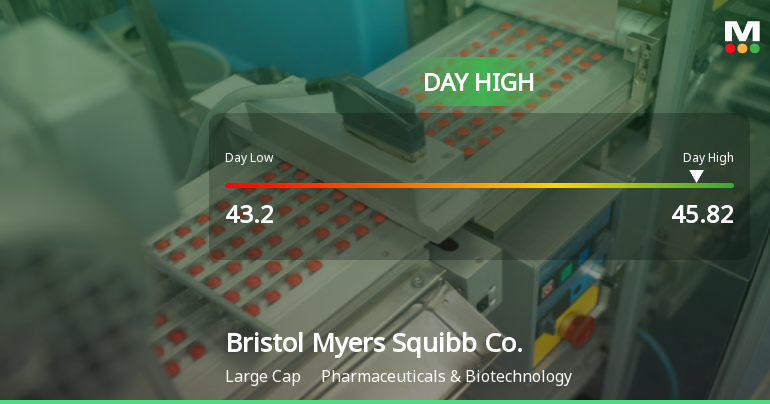
Bristol Myers Squibb Stock Hits Day High with 7.09% Surge
2025-10-31 16:51:52Bristol Myers Squibb Co. saw a notable increase in stock performance on October 30, 2025, reaching an intraday high. The company has demonstrated resilience with a solid annual net sales growth rate and strong operating cash flow, alongside high institutional ownership, indicating investor confidence.
Read full news article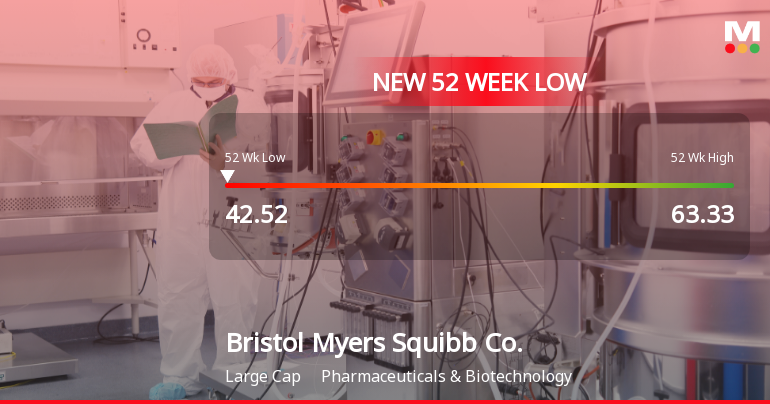
Bristol Myers Squibb Co. Hits New 52-Week Low at $42.52
2025-10-30 18:05:48Bristol Myers Squibb Co. has reached a new 52-week low, reflecting significant stock volatility. With a market capitalization of approximately USD 127,940 million, the company has a P/E ratio of 15.00 and a high dividend yield of 80.34%. Its return on equity stands at 51.19%, while the debt-to-equity ratio is 2.05.
Read full news article
Corporate Actions


