

Ceeta Industries Ltd Downgraded to Strong Sell Amid Technical and Fundamental Weakness
2026-06-23 08:38:13Ceeta Industries Ltd has been downgraded from a Sell to a Strong Sell rating as of 22 June 2026, reflecting a marked deterioration in its technical outlook and persistent fundamental weaknesses. The micro-cap FMCG company’s latest assessment highlights significant challenges across quality, valuation, financial trends, and technical indicators, signalling caution for investors amid a volatile market backdrop.
Read full news article
Ceeta Industries Ltd Upgraded to Sell on Technical Improvement Despite Weak Fundamentals
2026-06-16 08:41:48Ceeta Industries Ltd, a micro-cap player in the FMCG sector, has seen its investment rating upgraded from Strong Sell to Sell as of 15 June 2026, driven primarily by a shift in technical indicators despite persistent fundamental challenges. The company’s Mojo Score now stands at 38.0, reflecting a cautious but improved outlook amid flat financial performance and valuation concerns.
Read full news article
Ceeta Industries Ltd Downgraded to Strong Sell Amidst Flat Financials and Valuation Concerns
2026-06-09 08:48:25Ceeta Industries Ltd, a micro-cap player in the FMCG sector, has been downgraded from a Sell to a Strong Sell rating as of 8 June 2026, reflecting deteriorating fundamentals and valuation pressures. Despite a modest 1.43% day gain, the company’s flat quarterly financial performance and weak long-term metrics have prompted a reassessment of its investment appeal.
Read full news article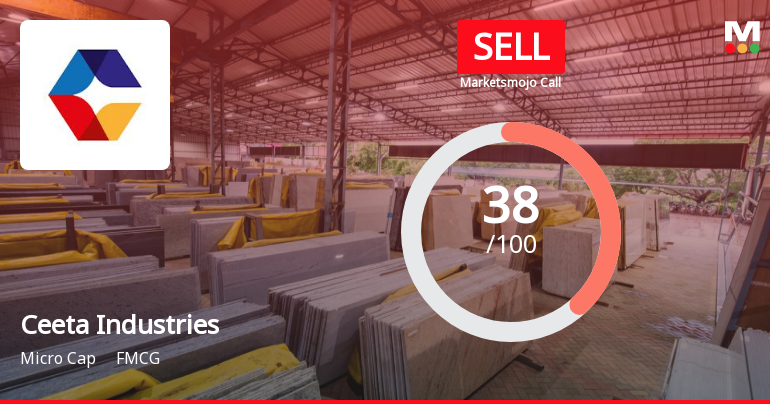
Ceeta Industries Ltd is Rated Sell
2026-06-03 10:10:33Ceeta Industries Ltd is rated Sell by MarketsMOJO, with this rating last updated on 18 May 2026. However, the analysis and financial metrics discussed here reflect the stock’s current position as of 03 June 2026, providing investors with the latest insights into the company’s fundamentals, valuation, financial trends, and technical outlook.
Read full news article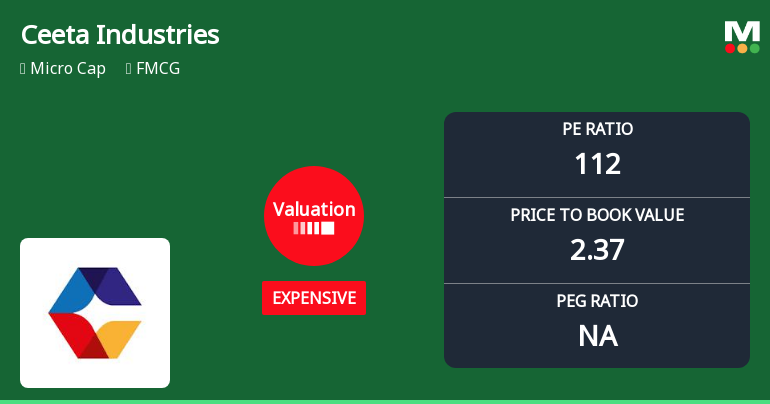
Ceeta Industries Ltd Valuation Shifts Signal Expensive Market Position Amid Mixed Returns
2026-06-01 08:02:12Ceeta Industries Ltd, a micro-cap player in the FMCG sector, has witnessed a marked shift in its valuation parameters, moving from a risky to an expensive classification. Despite a robust long-term return profile, the stock’s elevated price-to-earnings (P/E) and price-to-book value (P/BV) ratios have raised concerns among investors, prompting a downgrade in its Mojo Grade from Strong Sell to Sell as of 18 May 2026.
Read full news articleAre Ceeta Industries Ltd latest results good or bad?
2026-05-29 19:44:56Ceeta Industries Ltd's latest financial results for Q4 FY26 present a complex picture of operational performance. The company reported a net profit of ₹0.16 crores, reflecting a significant recovery of 60.0% from the previous quarter. However, this positive development is overshadowed by a substantial decline in revenue, which fell to ₹3.94 crores, marking a 41.11% decrease quarter-on-quarter and a 21.51% decrease year-on-year. This revenue drop raises concerns about demand stability and operational consistency within the company. Despite the revenue challenges, Ceeta Industries managed to improve its operating margin to 8.12%, up from 3.29% in the previous quarter, indicating better cost management practices. The PAT margin also saw an improvement, reaching 4.06%, which suggests that the company is working to enhance profitability even amidst declining sales. The financial performance highlights a troubl...
Read full news article
Ceeta Industries Q4 FY26: Sharp Revenue Decline Masks Marginal Profit Recovery
2026-05-29 09:37:52Ceeta Industries Ltd., a micro-cap FMCG company specialising in HDPE woven sacks and synthetic yarn manufacturing, reported a mixed performance in Q4 FY26 (Mar'26), with net profit recovering marginally to ₹0.16 crores despite a sharp 41.11% sequential revenue decline. The stock, currently trading at ₹48.80 with a market capitalisation of ₹71.00 crores, has gained 4.90% in today's session, though it remains significantly overvalued at 187 times trailing earnings amidst persistent operational challenges.
Read full news article
Ceeta Industries Ltd Upgraded to Sell on Technical Improvements Despite Flat Financials
2026-05-19 08:37:47Ceeta Industries Ltd, a micro-cap player in the FMCG sector, has seen its investment rating upgraded from Strong Sell to Sell as of 18 May 2026. This change reflects a nuanced shift in the company’s technical outlook despite persistent fundamental challenges. The upgrade is primarily driven by improved technical indicators, while valuation and financial trends remain subdued, underscoring a cautious stance for investors.
Read full news article
Ceeta Industries Ltd Downgraded to Strong Sell Amid Technical and Fundamental Weaknesses
2026-05-12 08:38:06Ceeta Industries Ltd, a micro-cap player in the FMCG sector, has seen its investment rating downgraded from Sell to Strong Sell as of 11 May 2026. This shift reflects deteriorating technical indicators, stagnant financial performance, and weak valuation metrics, signalling heightened risk for investors despite the stock’s recent outperformance against the Sensex over longer horizons.
Read full news articleAnnouncement under Regulation 30 (LODR)-Newspaper Publication
29-May-2026 | Source : BSECopy of audited financial results for the fourth quarter and year ended 31.03.2026.
Announcement under Regulation 30 (LODR)-Newspaper Publication
29-May-2026 | Source : BSECopy of audited financial results for the fourth quarter and year ended 31.03.2026.
Re-Appointment Of Secretarial Auditor And Internal Auditor Of The Company For The Financial Year 2026-2027.
28-May-2026 | Source : BSEThis is for your Information and record.
Corporate Actions

No Upcoming Board Meetings

No Dividend history available

No Splits history available

No Bonus history available

No Rights history available


