

Key Events This Week
1 June: Stock opens strong at Rs.1,096.90 (+3.82%) amid technical momentum shift
2 June: Technical momentum signals bullish outlook with sustained gains
3 June: New 52-week high reached at Rs.1,175
5 June: Week closes at Rs.1,180.95, up 11.78% for the week

Broad-Based Technical Strength Lifts Chennai Petroleum Corporation Ltd to 52-Week High of Rs 1242.85
2026-06-10 09:35:07Surging past its previous highs, Chennai Petroleum Corporation Ltd touched a fresh 52-week peak of Rs 1242.85 on 10 Jun 2026, marking a remarkable 82.37% gain over the past year. This milestone comes amid a backdrop of strong technical momentum and sustained upward price action, even as the broader Sensex trades below its 50-day moving average.
Read full news article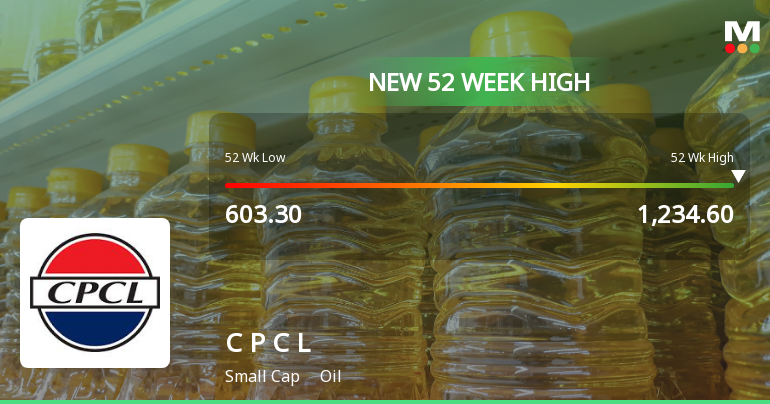
Broad-Based Technical Strength Lifts Chennai Petroleum Corporation Ltd to 52-Week High of Rs 1234.6
2026-06-09 15:35:04With a remarkable surge to Rs 1234.6 on 09 Jun 2026, Chennai Petroleum Corporation Ltd has reached a fresh 52-week high, marking an 88.8% rally over the past year. This milestone comes amid a backdrop of strong technical momentum and sustained upward price action, setting the stock apart in a market where the Sensex has struggled to maintain its footing.
Read full news article
Chennai Petroleum Corporation Ltd is Rated Strong Buy
2026-06-08 10:10:04Chennai Petroleum Corporation Ltd is rated 'Strong Buy' by MarketsMOJO, with this rating last updated on 24 February 2026. However, the analysis and financial metrics discussed here reflect the company’s current position as of 08 June 2026, providing investors with the latest insights into its performance and outlook.
Read full news article
Chennai Petroleum Corporation Ltd is Rated Strong Buy
2026-06-07 10:10:05Chennai Petroleum Corporation Ltd is rated Strong Buy by MarketsMOJO, with this rating last updated on 24 February 2026. However, the analysis and financial metrics presented here reflect the stock’s current position as of 08 June 2026, providing investors with the latest insights into its performance and outlook.
Read full news article
Chennai Petroleum Corporation Ltd is Rated Strong Buy
2026-06-06 10:10:05Chennai Petroleum Corporation Ltd is rated Strong Buy by MarketsMOJO, with this rating last updated on 24 February 2026. However, the analysis and financial metrics presented here reflect the stock’s current position as of 08 June 2026, providing investors with the most recent and relevant data to assess the company’s investment potential.
Read full news article
Chennai Petroleum Corporation Ltd is Rated Strong Buy
2026-06-05 10:10:05Chennai Petroleum Corporation Ltd is rated Strong Buy by MarketsMOJO, with this rating last updated on 24 February 2026. However, all fundamentals, returns, and financial metrics discussed here reflect the stock's current position as of 08 June 2026, providing investors with the latest comprehensive analysis.
Read full news article


