
CureVac NV Faces Valuation Shift Amid Declining Financial Performance Indicators
2025-11-26 15:53:20CureVac NV, a small-cap biotechnology firm, has undergone a recent evaluation adjustment reflecting changes in its valuation metrics. While the company demonstrates strong efficiency in generating profits, it faces challenges with declining net sales and profitability, highlighting the complexities of its financial situation.
Read MoreIs CureVac NV overvalued or undervalued?
2025-10-28 11:13:17As of 24 October 2025, the valuation grade for CureVac NV has moved from attractive to very attractive, indicating a strong improvement in its perceived value. The company is currently considered undervalued, supported by a P/E ratio of 5, an EV to EBITDA of 1.90, and a PEG ratio of 0.03, which suggests significant growth potential relative to its price. In comparison to its peers, CureVac NV's P/E ratio is notably lower than PTC Therapeutics, Inc. at 5.85 and Harmony Biosciences Holdings, Inc. at 11.40, reinforcing its undervaluation. Additionally, while CureVac has experienced a year-to-date return of 57.18%, significantly outperforming the S&P 500's return of 15.47%, its long-term performance over the past five years shows a decline of 89.29%, highlighting volatility. Overall, these metrics suggest that CureVac NV is positioned as an attractive investment opportunity within the pharmaceuticals and biot...
Read MoreIs CureVac NV overvalued or undervalued?
2025-10-27 11:13:22As of 24 October 2025, the valuation grade for CureVac NV has moved from attractive to very attractive, indicating a strong improvement in its perceived value. The company appears to be undervalued with a P/E ratio of 5, significantly lower than its peer PTC Therapeutics, Inc., which has a P/E of 5.85, and Harmony Biosciences Holdings, Inc. at 11.40. Additionally, CureVac's EV to EBITDA ratio of 1.90 and a PEG ratio of 0.03 further support this undervaluation narrative, suggesting that the stock is priced favorably compared to its growth potential. In terms of recent performance, CureVac NV has demonstrated a remarkable year-to-date return of 57.18%, vastly outperforming the S&P 500's return of 15.47% over the same period. However, it has faced challenges over the longer term, with a three-year return of -27.96% compared to the S&P 500's 78.85%. Overall, the combination of low valuation ratios and strong r...
Read MoreIs CureVac NV overvalued or undervalued?
2025-10-26 11:09:56As of 24 October 2025, the valuation grade for CureVac NV has moved from attractive to very attractive. The company appears to be undervalued, supported by a P/E ratio of 5, an EV to EBITDA ratio of 1.90, and an impressive PEG ratio of 0.03. In comparison with peers, PTC Therapeutics, Inc. has a P/E of 5.85 and an EV to EBITDA of 3.17, while Harmony Biosciences Holdings, Inc. shows a P/E of 11.40 and an EV to EBITDA of 6.94, indicating that CureVac NV is trading at a significant discount relative to its industry peers. CureVac NV has delivered a year-to-date return of 57.18%, significantly outperforming the S&P 500's return of 15.47%, which reinforces the notion that the stock is undervalued given its strong performance metrics and favorable valuation ratios....
Read MoreIs CureVac NV technically bullish or bearish?
2025-09-20 20:29:39As of 18 August 2025, the technical trend for CureVac NV has changed from bullish to mildly bullish. The weekly MACD is mildly bearish, while the monthly MACD is mildly bullish, indicating mixed signals. The Bollinger Bands are bullish on the weekly and mildly bullish on the monthly, supporting a positive outlook. Daily moving averages are mildly bullish, suggesting some short-term strength. However, the KST is mildly bearish on the weekly and bullish on the monthly, adding to the mixed sentiment. CureVac has shown strong performance year-to-date with a return of 56.89%, significantly outperforming the S&P 500's 12.22%. Over the past year, it also outperformed the benchmark with a return of 62.61% compared to the S&P 500's 17.14%. However, longer-term returns over 3, 5, and 10 years are notably negative compared to the S&P 500. Overall, the current stance is mildly bullish, driven by the mixed indicators ...
Read MoreIs CureVac NV overvalued or undervalued?
2025-09-20 18:48:53As of 12 September 2025, the valuation grade for CureVac NV has moved from attractive to very attractive, indicating a significant improvement in its perceived value. The company appears undervalued, supported by a P/E ratio of 5, an EV to EBITDA of 1.90, and a PEG ratio of 0.03, all of which are considerably lower than industry norms. In comparison, PTC Therapeutics, Inc. has a P/E of 5.85 and an EV to EBITDA of 3.17, while Harmony Biosciences Holdings, Inc. shows a P/E of 11.40, highlighting CureVac's relative valuation advantage. Despite recent underperformance over shorter time frames, with a 1-week return of -0.74% compared to the S&P 500's 1.05%, CureVac has outperformed the index year-to-date with a return of 56.89% versus 12.22% for the S&P 500. This suggests that while the stock may be experiencing volatility, its long-term potential remains strong, reinforcing the view that it is currently underv...
Read More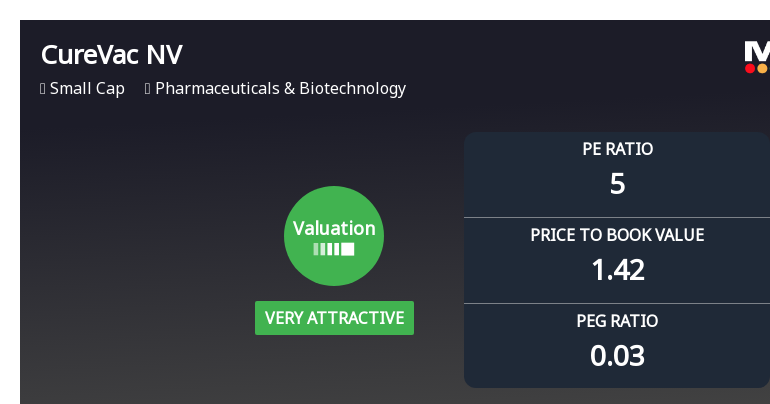
CureVac NV Experiences Revision in Its Stock Evaluation Amid Strong Financial Metrics
2025-09-16 18:03:30CureVac NV, a small-cap in the Pharmaceuticals & Biotechnology sector, has recently adjusted its valuation metrics. With a P/E ratio of 5 and strong returns on capital and equity, the company demonstrates operational efficiency and profitability, positioning itself competitively against peers in the industry.
Read More
Corporate Actions


