

Dynemic Products Ltd is Rated Sell by MarketsMOJO
2026-07-03 10:10:04Dynemic Products Ltd is rated 'Sell' by MarketsMOJO, with this rating last updated on 30 May 2026. However, the analysis and financial metrics discussed here reflect the stock's current position as of 03 July 2026, providing investors with an up-to-date perspective on the company’s performance and outlook.
Read full news article
Dynemic Products Ltd is Rated Sell
2026-06-22 10:11:11Dynemic Products Ltd is rated 'Sell' by MarketsMOJO, with this rating last updated on 30 May 2026. However, the analysis and financial metrics discussed here reflect the stock's current position as of 22 June 2026, providing investors with the most up-to-date view of the company’s fundamentals and market performance.
Read full news article
Dynemic Products Ltd is Rated Sell
2026-06-11 10:10:04Dynemic Products Ltd is rated 'Sell' by MarketsMOJO, with this rating last updated on 30 May 2026. However, the analysis and financial metrics presented here reflect the stock's current position as of 11 June 2026, providing investors with an up-to-date view of the company's fundamentals, valuation, financial trends, and technical outlook.
Read full news article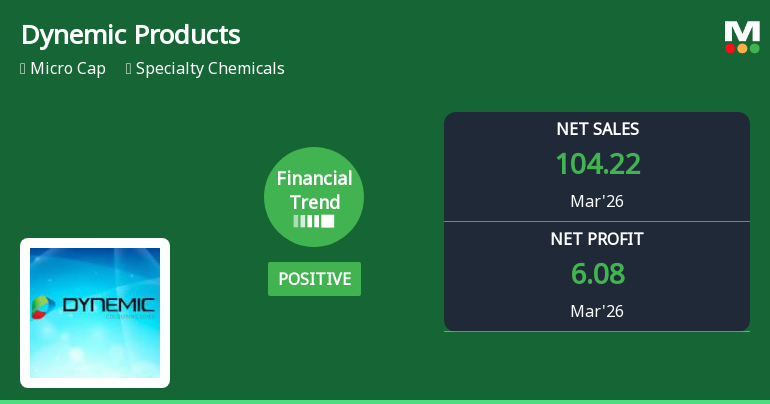
Dynemic Products Ltd Reports Positive Financial Trend Amid Market Challenges
2026-06-10 15:00:14Dynemic Products Ltd, a micro-cap player in the specialty chemicals sector, has demonstrated a notable improvement in its financial performance for the quarter ended March 2026. The company’s financial trend score has shifted from very positive to positive, reflecting stronger revenue growth and margin expansion compared to its historical performance, despite ongoing challenges in cash reserves.
Read full news article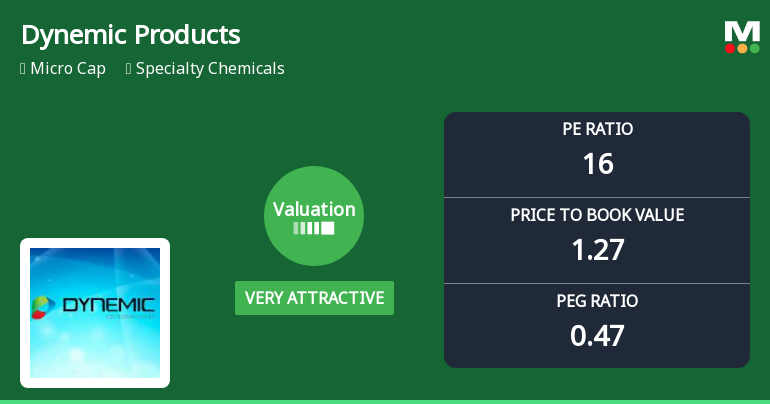
Dynemic Products Ltd Valuation Shifts Signal Renewed Price Attractiveness
2026-06-02 08:01:16Dynemic Products Ltd, a micro-cap player in the Specialty Chemicals sector, has witnessed a significant improvement in its valuation parameters, shifting from an attractive to a very attractive rating. Despite a recent day decline of 3.13%, the stock’s price-to-earnings (P/E) and price-to-book value (P/BV) ratios now present a compelling case for investors seeking value within a challenging industry backdrop.
Read full news articleAre Dynemic Products Ltd latest results good or bad?
2026-05-30 19:44:03Dynemic Products Ltd reported its financial results for the quarter ending March 2026, showcasing notable developments in its performance metrics. The company achieved a consolidated net profit of ₹6.08 crores, reflecting a significant year-on-year growth of 54.31%, compared to a slight decline of 2.96% in the same quarter last year. This marks a recovery from previous challenging periods, as the net profit had been just ₹3.94 crores in March 2025. Revenue for the same quarter reached ₹104.22 crores, which represents a year-on-year increase of 10.77%, although this growth rate is lower than the 19.18% seen in the prior year. The operating profit margin, excluding other income, improved to 14.70%, up by 128 basis points from 13.42% in the previous year, indicating effective cost management and operational leverage. Despite these positive quarterly results, Dynemic Products continues to face underlying oper...
Read full news article
Dynemic Products Q4 FY26: Strong Profit Surge Masks Underlying Challenges
2026-05-30 12:18:16Dynemic Products Ltd., a specialty chemicals manufacturer, posted a consolidated net profit of ₹6.08 crores for the quarter ended March 2026 (Q4 FY26), marking a robust 54.31% surge year-on-year and a 31.89% sequential improvement. The stock responded favourably, rallying 10.45% to ₹259.00 following the results announcement, though it remains 37.55% below its 52-week high of ₹414.70. With a market capitalisation of ₹275.00 crores, the micro-cap company operates in the competitive specialty chemicals space, serving the food colour and reactive dyes segments.
Read full news article
Dynemic Products Ltd is Rated Strong Sell
2026-05-29 10:11:03Dynemic Products Ltd is rated Strong Sell by MarketsMOJO. This rating was last updated on 21 Nov 2025, reflecting a change from the previous 'Sell' grade. However, the analysis and financial metrics discussed below represent the stock's current position as of 29 May 2026, providing investors with the latest insights into the company’s performance and outlook.
Read full news articleCompliances-Certificate under Reg. 74 (5) of SEBI (DP) Regulations 2018
07-Jul-2026 | Source : BSECertificate under Regulation 74(5) of SEBI (DP) Regulations 2018
Communication To Shareholders - Intimation On Tax Deduction On Dividend
06-Jul-2026 | Source : BSECommunication to Shareholders - Intimation on Tax Deduction on Dividend
Closure of Trading Window
24-Jun-2026 | Source : BSEIntimation of Closure of Trading Window
Corporate Actions

No Upcoming Board Meetings

Dynemic Products Ltd has declared 15% dividend, ex-date: 26 Feb 20

No Splits history available

No Bonus history available

Dynemic Products Ltd has announced 1:20 rights issue, ex-date: 12 May 22


