
Key Events This Week
1 Jun: Stock opens at Rs.178.65, down 1.27% amid broader market weakness
2 Jun: Quality grade downgrade to average announced, stock closes Rs.180.30 (+0.92%)
4 Jun: Technical momentum shifts noted, stock declines to Rs.174.20 (-1.83%)
5 Jun: Strong rebound with 7.52% gain, closing at Rs.187.30

EFC (I) Ltd Technical Momentum Shifts Amid Bearish Outlook
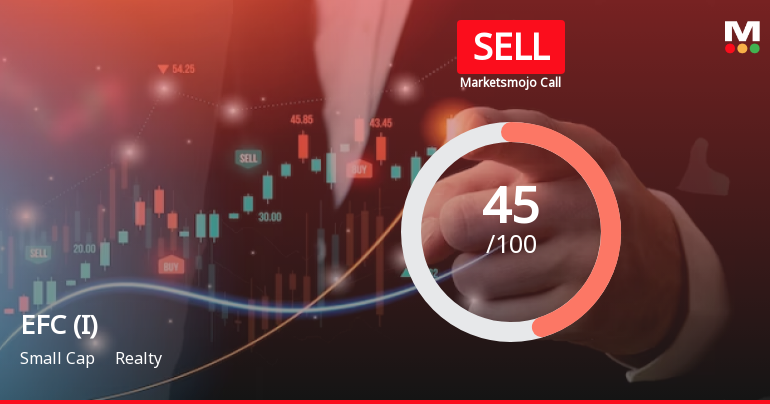
2026-06-12 08:02:49EFC (I) Ltd, a small-cap player in the Realty sector, has experienced a subtle shift in its technical momentum, moving from a bearish to a mildly bearish trend. Despite a modest day gain of 1.84%, the stock’s broader technical indicators and fundamental metrics suggest a cautious outlook, with MarketsMOJO downgrading its mojo grade from Hold to Sell on 18 Nov 2025.
Read full news article
EFC (I) Ltd Technical Momentum Shifts Amid Bearish Outlook
2026-06-10 08:03:36EFC (I) Ltd, a small-cap player in the Realty sector, has experienced a notable shift in its technical momentum, prompting a downgrade in its MarketsMOJO grade from Hold to Sell as of 18 Nov 2025. Despite a modest weekly price gain, the stock’s broader technical indicators signal increasing bearishness, reflecting challenges in sustaining upward momentum amid a tough market environment.
Read full news article
EFC (I) Ltd is Rated Sell by MarketsMOJO
2026-06-09 10:10:44EFC (I) Ltd is rated 'Sell' by MarketsMOJO, with this rating last updated on 29 May 2026. However, the analysis and financial metrics discussed here reflect the stock’s current position as of 09 June 2026, providing investors with an up-to-date view of the company’s performance and outlook.
Read full news article
EFC (I) Ltd Technical Momentum Shifts Amidst Prolonged Downtrend
2026-06-04 08:02:51EFC (I) Ltd, a small-cap player in the realty sector, has experienced a notable shift in its technical momentum, reflecting a complex interplay of bearish and mildly bullish signals. Despite a recent downgrade from Hold to Sell by MarketsMOJO on 18 Nov 2025, the stock’s technical indicators reveal nuanced trends that investors should carefully analyse amid ongoing price pressures and sector challenges.
Read full news article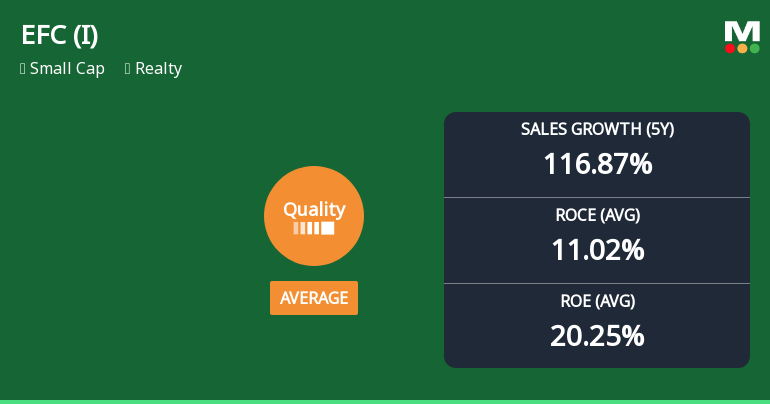
EFC (I) Ltd Quality Grade Downgrade Highlights Fundamental Challenges
2026-06-02 08:00:38EFC (I) Ltd, a small-cap player in the Realty sector, has seen its quality grade downgraded from good to average as of 18 Nov 2025, reflecting a shift in its business fundamentals. This downgrade accompanies a Sell rating with a Mojo Score of 40.0, signalling growing concerns over the company’s financial health and operational consistency amid a challenging market environment.
Read full news articleAre EFC (I) Ltd latest results good or bad?
2026-05-30 19:52:22EFC (I) Ltd's latest financial results for Q4 FY26 reflect a complex operational landscape characterized by strong revenue growth but notable challenges in profitability and financial stability. The company reported consolidated net sales of ₹292.88 crores, marking a year-on-year increase of 38.80% and a sequential growth of 8.64%. This performance represents the highest quarterly revenue on record, indicating robust demand in its real estate and property management segments. However, despite the impressive top-line growth, the company's profitability metrics reveal some pressure. The consolidated net profit reached ₹69.40 crores, which is a significant year-on-year increase of 58.16% and a sequential growth of 9.74%. Yet, the operating margin (excluding other income) contracted to 49.02%, down from 51.80% in the previous year, suggesting rising input costs or competitive pricing pressures that are impacti...
Read full news article


