


Key Events This Week
May 25: Stock declines 3.35% amid broad market rally
May 26: Continued modest decline despite Sensex dip
May 27: Sharp 4.14% rebound on strong volume
May 29: Stock plunges 5.29% following mixed quarterly results
Are EFC (I) Ltd latest results good or bad?
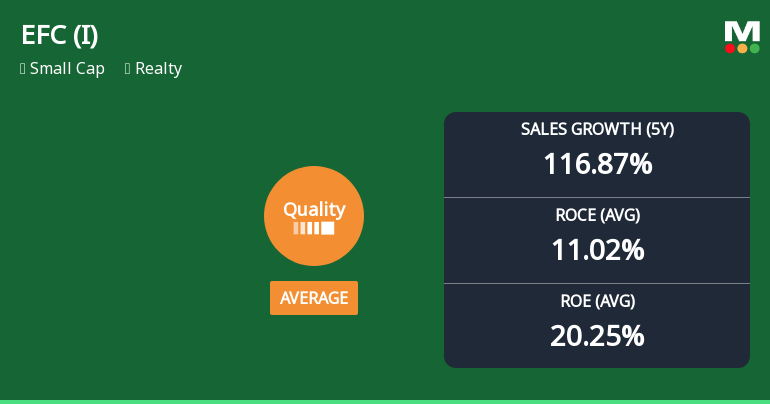
2026-05-29 19:49:21EFC (I) Limited's latest financial results for the quarter ended March 2026 reveal a mixed operational performance. The company reported consolidated net sales of ₹292.88 crores, reflecting a sequential growth of 8.64% compared to ₹269.59 crores in the previous quarter. This indicates a continuation of revenue growth, building on the strong year-on-year expansion seen previously. However, the consolidated net profit for the same period was ₹69.40 crores, which represents a sequential growth of 9.74%, a decline from the 13.95% growth recorded in the prior quarter. This suggests a deceleration in profit growth despite the ongoing revenue increase. The operating profit margin, excluding other income, showed a notable change, reaching 49.02%, which is an improvement from the 41.43% reported in the previous quarter. This indicates a potential recovery in operational efficiency, although it is essential to moni...
Read full news article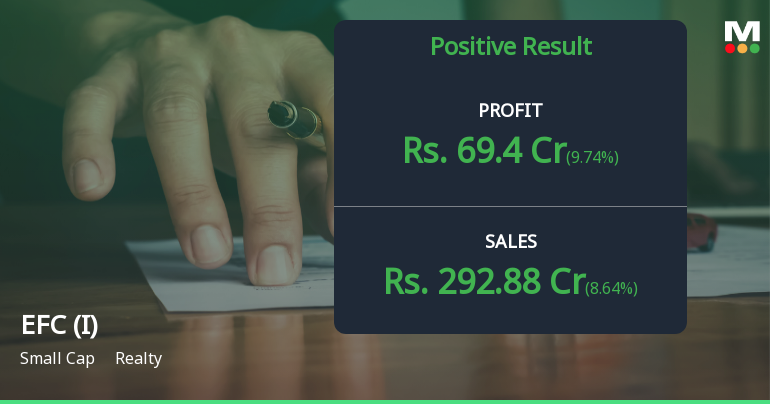
EFC (I) Ltd Q4 FY26: Strong Earnings Growth Masks Mounting Debt Concerns
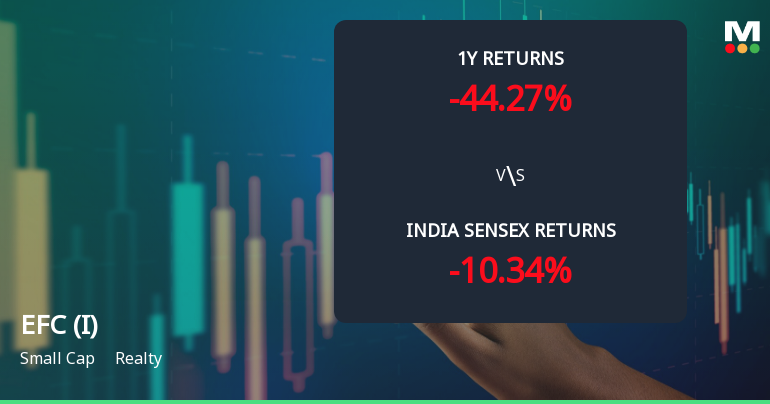
2026-05-29 16:30:34EFC (I) Limited, formerly Amani Trading and Exports Limited, delivered a robust fourth-quarter performance for FY26, posting consolidated net profit of ₹69.40 crores—a sequential gain of 9.74% and an impressive year-on-year surge of 58.16%. However, the stock has responded negatively to the results, tumbling 5.29% in the trading session following the announcement, reflecting investor concerns over rising debt levels and deteriorating technical momentum. With a market capitalisation of ₹2,742 crores, the small-cap realty player trades at ₹180.95, down significantly from its 52-week high of ₹373.70.
Read full news article


