
Is Electronic Arts, Inc. overvalued or undervalued?
2025-10-21 12:03:42As of 17 October 2025, the valuation grade for Electronic Arts, Inc. has moved from fair to expensive. The company is currently overvalued based on its valuation ratios, which include a P/E ratio of 32, a Price to Book Value of 5.87, and an EV to EBITDA of 18.91. In comparison, peers such as The Trade Desk, Inc. have a higher P/E of 60.98 and an EV to EBITDA of 41.76, indicating that Electronic Arts is not the most expensive in its sector, but still carries a premium. Despite the recent stock performance, where Electronic Arts has outperformed the S&P 500 with a year-to-date return of 36.91% compared to 13.30%, the overall valuation suggests caution. Given the elevated valuation metrics, the stock appears to be priced for perfection, making it less attractive for new investments at this time....
Read full news article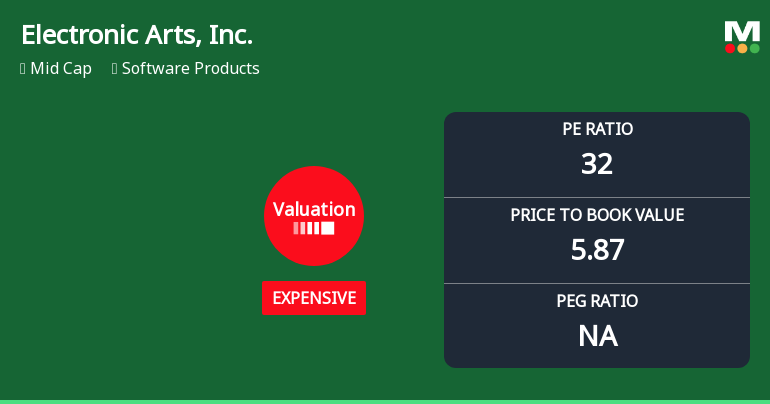
Electronic Arts, Inc. Experiences Valuation Adjustment Amid Strong Market Performance
2025-10-20 15:57:02Electronic Arts, Inc. has recently adjusted its valuation metrics, reporting a P/E ratio of 32 and a price-to-book value of 5.87. The company also features a strong dividend yield of 54.89% and notable returns on capital and equity, reflecting its competitive position in the software products industry.
Read full news articleIs Electronic Arts, Inc. overvalued or undervalued?
2025-10-20 12:21:16As of 17 October 2025, the valuation grade for Electronic Arts, Inc. has moved from fair to expensive. The company appears to be overvalued based on its current metrics. The P/E ratio stands at 32, while the industry average is not provided, indicating a potential premium. Additionally, the EV to EBITDA ratio is 18.91, and the Price to Book Value is 5.87, both suggesting a higher valuation relative to typical industry standards. In comparison to peers, Electronic Arts, Inc. has a higher P/E ratio than The Trade Desk, Inc., which has a P/E of 60.98, and a lower EV to EBITDA ratio than its peer at 41.76. Despite recent strong performance, with a year-to-date return of 36.91% compared to the S&P 500's 13.30%, the overall valuation metrics indicate that the stock is not justified at its current price level....
Read full news articleIs Electronic Arts, Inc. overvalued or undervalued?
2025-10-19 11:58:48As of 17 October 2025, the valuation grade for Electronic Arts, Inc. has moved from fair to expensive. The company is currently overvalued based on its valuation ratios, which include a P/E ratio of 32, a Price to Book Value of 5.87, and an EV to EBITDA of 18.91. In comparison, peers such as The Trade Desk, Inc. show a higher P/E ratio of 60.98 and an EV to EBITDA of 41.76, indicating that Electronic Arts is relatively less expensive among its peers, yet still classified as expensive. Despite its strong performance, with a year-to-date return of 36.91% compared to the S&P 500's 13.30%, the company's valuation metrics suggest that it may not be a prudent investment at current levels. The significant disparity in long-term returns, with Electronic Arts showing a 10-year return of 51.83% against the S&P 500's 227.77%, further emphasizes the caution needed when considering its current valuation....
Read full news article
Corporate Actions


