Key Events This Week
15 Jun: Stock opens at ₹348.90, up 1.06% amid positive market sentiment
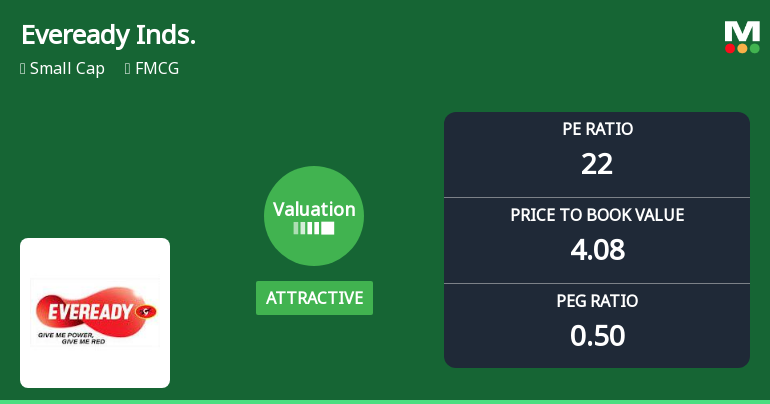
16 Jun: Technical momentum shifts amid mixed signals; valuation metrics improve
18 Jun: Upgrade to Hold rating on improved technicals and valuation; mild bullish outlook confirmed
19 Jun: Stock closes at ₹368.95, up 3.39%, ending the week on a strong note
Week Open
Rs.345.25