

Global Vectra Helicorp Ltd is Rated Strong Sell
2026-06-11 10:10:22Global Vectra Helicorp Ltd is rated Strong Sell by MarketsMOJO, with this rating last updated on 07 July 2025. However, the analysis and financial metrics presented here reflect the company’s current position as of 11 June 2026, providing investors with an up-to-date view of its fundamentals, returns, and overall outlook.
Read full news article
Global Vectra Helicorp Ltd is Rated Strong Sell
2026-05-29 10:10:22Global Vectra Helicorp Ltd is rated Strong Sell by MarketsMOJO, with this rating last updated on 07 Jul 2025. However, the analysis and financial metrics presented here reflect the company’s current position as of 29 May 2026, providing investors with an up-to-date view of its fundamentals, returns, and overall market standing.
Read full news articleWhen is the next results date for Global Vectra Helicorp Ltd?
2026-05-20 23:18:28The next results date for Global Vectra Helicorp Ltd is scheduled for 27 May 2026....
Read full news article
Global Vectra Helicorp Ltd is Rated Strong Sell
2026-05-18 10:10:16Global Vectra Helicorp Ltd is rated Strong Sell by MarketsMOJO, with this rating last updated on 07 Jul 2025. However, the analysis and financial metrics discussed here reflect the company’s current position as of 18 May 2026, providing investors with an up-to-date view of its fundamentals, returns, and overall outlook.
Read full news article
Global Vectra Helicorp Ltd is Rated Strong Sell
2026-05-07 10:10:27Global Vectra Helicorp Ltd is rated 'Strong Sell' by MarketsMOJO, with this rating last updated on 07 Jul 2025. However, the analysis and financial metrics discussed here reflect the company’s current position as of 07 May 2026, providing investors with an up-to-date view of its fundamentals, returns, and overall market standing.
Read full news article
Global Vectra Helicorp Ltd is Rated Strong Sell
2026-04-26 10:10:13Global Vectra Helicorp Ltd is rated Strong Sell by MarketsMOJO, with this rating last updated on 07 July 2025. However, the analysis and financial metrics discussed here reflect the stock's current position as of 26 April 2026, providing investors with an up-to-date view of the company’s fundamentals, returns, and overall market standing.
Read full news article
Global Vectra Helicorp Ltd is Rated Strong Sell
2026-04-15 10:10:17Global Vectra Helicorp Ltd is rated Strong Sell by MarketsMOJO, with this rating last updated on 07 Jul 2025. However, the analysis and financial metrics discussed here reflect the company’s current position as of 15 April 2026, providing investors with an up-to-date view of its fundamentals, returns, and overall outlook.
Read full news article
Global Vectra Helicorp Ltd is Rated Strong Sell
2026-04-04 10:10:13Global Vectra Helicorp Ltd is rated Strong Sell by MarketsMOJO, with this rating last updated on 07 July 2025. However, the analysis and financial metrics discussed here reflect the stock’s current position as of 04 April 2026, providing investors with an up-to-date view of the company’s fundamentals, returns, and overall outlook.
Read full news article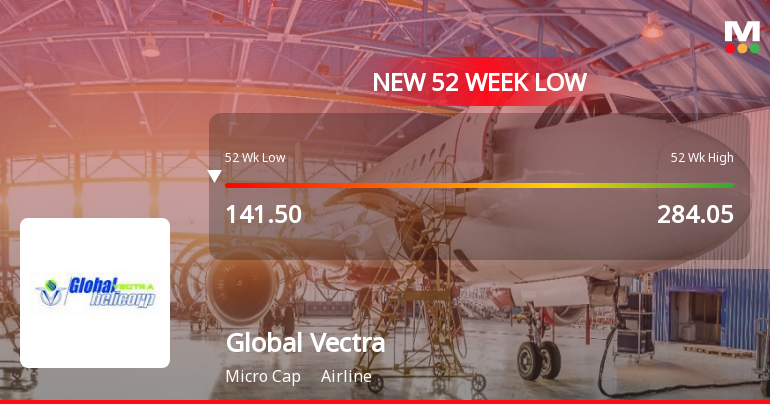
Global Vectra Helicorp Ltd Falls to 52-Week Low of Rs 135 as Sell-Off Deepens
2026-03-30 11:31:02For the third consecutive session, Global Vectra Helicorp Ltd has seen its share price decline sharply, hitting a fresh 52-week low of Rs 135 on 30 Mar 2026. This marks a significant 52.5% drop from its 52-week high of Rs 284.05, underscoring the persistent downward pressure on the stock amid a challenging market environment.
Read full news articleCompliances-Reg.24(A)-Annual Secretarial Compliance
29-May-2026 | Source : BSEPursuant to Regulation 24A of SEBI (Listing Obligations and Disclosure Requirements) Regulations 2015 as amended we enclose the Annual Secretarial Compliance Report for the Financial Year ended on March 31 2026.
Announcement under Regulation 30 (LODR)-Newspaper Publication
28-May-2026 | Source : BSEPursuant to provisions of Regulation 47 of the SEBI (Listing Obligations and Disclosure Requirements) Regulaiton 2015 we are enclosing copies of the Business Standard (English Newspaper) and Business Standard (Hindi Newspaper) dated 28th May 2026 in which extract of Audited Financial Results for the quarter and year ended 31st March 2026 have been published.
Board Meeting Outcome for Submission Of Audited Financial Results And Audit Report For The Quarter And Year Ended 31 March 2026
27-May-2026 | Source : BSEPursuant to Regulation 33 of the Securities and Exchange Board of India (Listing Obligations and Disclosure Requirements) Regulations 2015 we enclose herewith: - a. Audited Financial Results of the Company for the Quarter and year ended March 31 2026 along with Statement of Assets & Liabilities and Cashflow Statement b. Independent Auditors Report. c. Declaration for Unmodified Opinion on Audit Report issued by the Statutory Auditors of the Company for the F.Y. 2025-26 under regulation 33(3)(d) of listing Regulations.
Corporate Actions

No Upcoming Board Meetings

No Dividend history available

No Splits history available

No Bonus history available

No Rights history available


